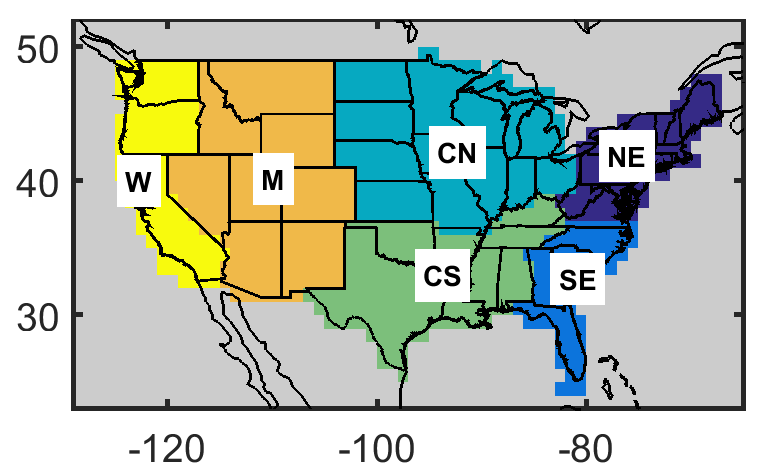
Gridded emissions are averaged over six regions in the continental United States and are displayed as regional emission time-series on the US EmissionTracker website. These figure uses the same color-coding as seen on the map below.
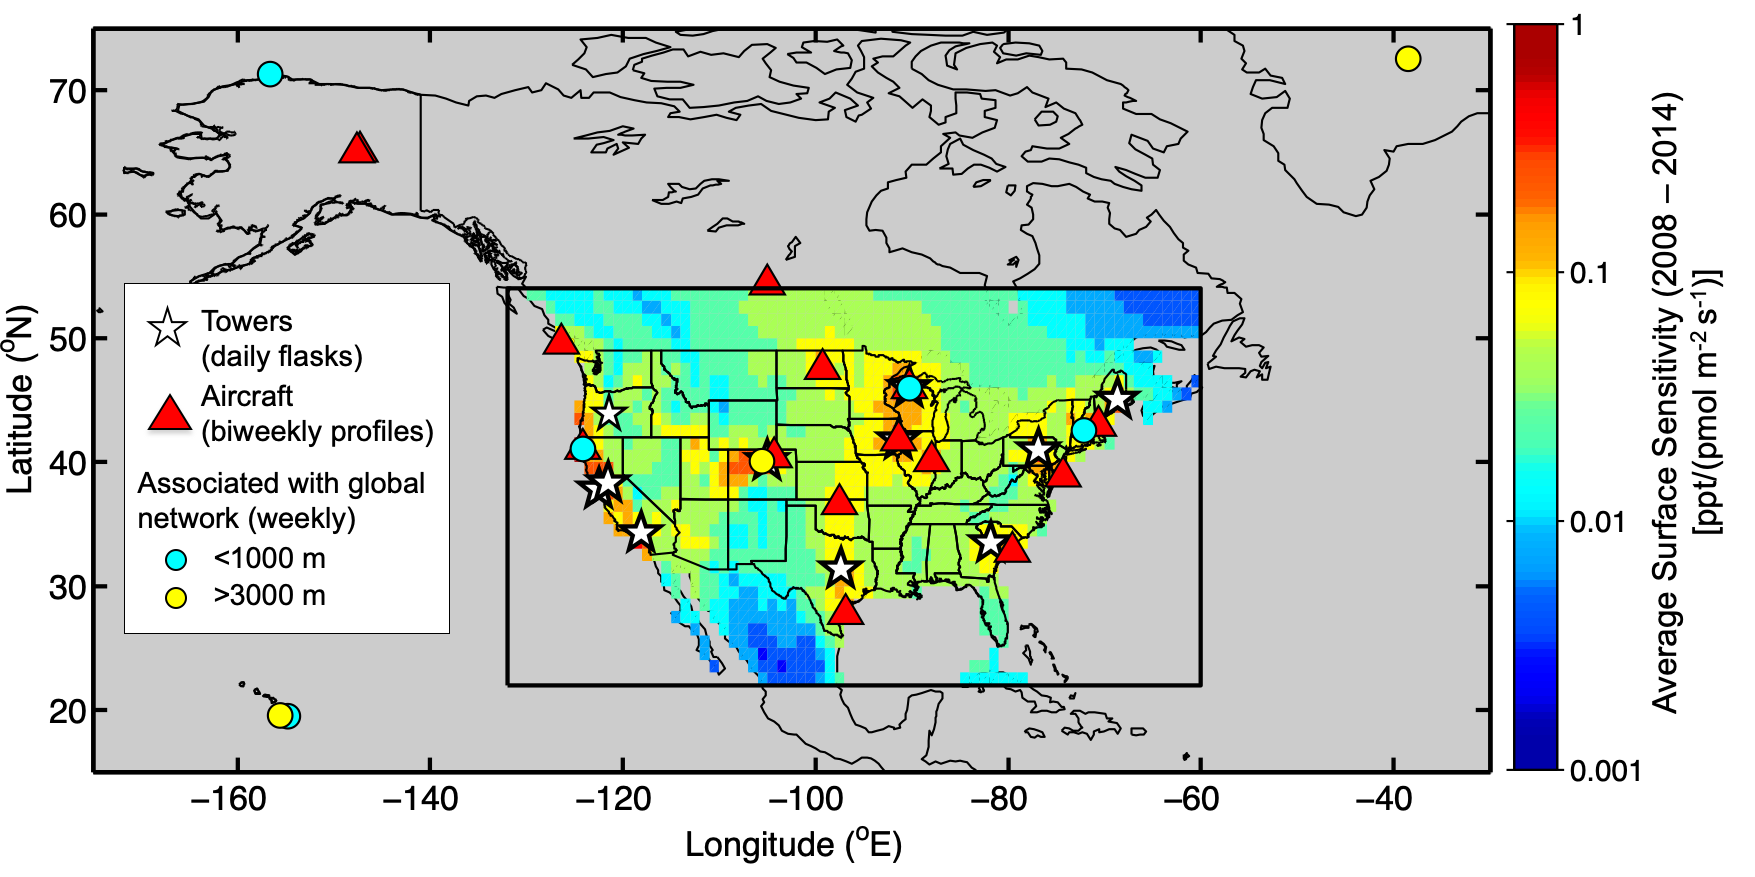
The map below shows the locations of NOAA's atmospheric measurements for halocarbon and other trace species. Color shading indicates their average sensitivity to US emissions between 2008 and 2014.