
abstract matches "Mauna, Loa"
144 matches.Click on page icon to view abstract.
High altitude mountaintop observatories provide the opportunity to study aerosol properties in the free troposphere without the added expense and difficulty of making airborne measurements. Climatologies for free tropospheric aerosol radiative properties in cloud-free air, including light scattering, light absorption, light extinction, single scattering albedo, Ångström exponent, hemispheric backscatter fraction and radiative forcing efficiency, from twelve high altitude (2.2–5.1 km) measurement platforms are presented at low relative humidity and at standard temperature and pressure. These climatologies utilize data from ten mountaintop observatories in the 20–50°N latitude band:Mauna Loa, USA; Lulin Mountain, Taiwan; Nepal Climate Observatory— Pyramid; Izaña, Spain; Mount Waliguan, China; Beo Moussala, Bulgaria; Mount Bachelor, USA; Monte Cimone, Italy; Jungfraujoch, Switzerland; Whistler Mountain, Canada. Results are also included from two multi-year, in-situ aerosol vertical profiling programs: Southern Great Plains, USA and Bondville, USA. The amount of light absorption and scattering observed at these high altitude sites either peaks in the spring or it has a broad spring to summer enhancement. The seasonal variation of the aerosol single scattering albedo, backscatter fraction and Ångström exponent changes from site to site but the timing can be related to aerosol sources and transport processes known to impact the individual sites. The seasonal variation of in-situ aerosol light extinction from these high altitude measurements is in excellent agreement with extinction values derived from CALIPSO lidar measurements. Analysis of the systematic variability among in-situ aerosol properties shows that these relationships can be used to infer aerosol types. In particular, the relationship between single scattering albedo and Ångström exponent can indicate the presence of dust aerosol. Radiative forcing efficiency (RFE=aerosol forcing/aerosol optical depth) is used to assess the importance of single scattering albedo and backscatter fraction on aerosol forcing by eliminating aerosol amount (i.e., aerosol optical depth) fromthe calculation. Variability inmonthly cycles of RFE corresponds with changes in single scattering albedo and hemispheric backscatter fraction. Utilizing site-specific, climatological values of single scattering albedo and backscatter fraction to calculate RFE results in departures from the monthly median values of RFE typically in the range 10–30%. The greatest discrepancy occurs formonths with lowaerosol loadingwhere the observed variability of single scattering albedo and backscatter fraction is the greatest. At most sites the radiative forcing efficiency at low aerosol loading (light scattering < 10 Mm-1) is slightly less negative (more warming) than at higher aerosol loading.
Apparent solar transmission has been measured at the Mauna Loa Observatory in Hawaii by NOAA’s Global Monitoring Division and its predecessors since the International Geophysical Year in 1958. It is the longest record of its kind. Because the observatory is in a pristine environment, elevated far above the marine boundary layer, the Mauna Loa apparent transmission is
an effective proxy for stratospheric aerosol loading, although it is affected each spring by perennial tropospheric Asian dust events (Bodhaine et al. 1981). It has been used primarily to track background stratospheric aerosols and the decay of volcanic plumes that had been injected into the stratosphere. Other studies have examined the influence of water vapor, ozone, and the
Quasi-Biennial Oscillation (QBO) on the transmission at Mauna Loa (Dutton et al. 1985; Dutton and Bodhaine 2001; Dutton 1992).
Initiated in 1958 as part of the International Geophysical Year, one of the longest records of
atmospheric transmission, i.e., the percent of top of atmosphere (TOA) solar radiation that reaches
the surface, has been recorded on the island of Hawaii at 3397 m above mean sea level, just below
the summit of the Mauna Loa volcano. Because of the clean nature of the atmosphere over
Mauna Loa, its elevation and vertical separation from the marine boundary layer, atmospheric
transmission there is considered a proxy of stratospheric aerosol loading. One exception is the
effect from the annual transport of Asian dust over Hawaii at high-tropospheric levels in springtime
(Bodhaine et al. 1981).
A CCD-based bistatic lidar (CLidar) system has been developed and constructed to measure scattering in the atmospheric boundary layer. The system uses a CCD camera, wide-angle optics, and a laser. Imaging a vertical laser beam from the side allows high-altitude resolution in the boundary layer all the way to the ground. The dynamic range needed for the molecular signal is several orders of magnitude in the standard monostatic method, but only approximately 1 order of magnitude with the CLidar method. Other advantages of the Clidar method include low cost and simplicity. Observations at Mauna Loa Observatory, Hawaii, show excellent agreement with the modeled molecular-scattering signal. The scattering depends on angle (altitude) and the polarization plane of the laser.
Concentrations of carbon dioxide (CO2), methane (CH4), carbon monoxide (CO), nitrous oxide (N2O) and hydrogen (H2), and the stable carbon (δ 13C–CO2) and oxygen (δ 18O–CO2) isotopic composition of CO2 have been measured in air samples collected from Cabo de Rama (CRI), India, for the period 1993–2002. The observations show clear signatures of Northern and Southern Hemispheric (NH and SH) air masses, mixed with their regional fluxes and chemical loss mechanisms, resulting in complex seasonal variation of these gases. The CRI measurements are compared with remote marine sites at Seychelles and Mauna Loa. Simulations of two major anthropogenic green- house gases (CO2 and CH4) concentrations using a chemistry-transport model for the CRI site suggest that globally optimized fluxes can produce results comparable to the observations. We discuss that CRI observations have provided critical guidance in opti- mizing the fluxes to constrain the regional source/ sinks balance.
This paper presents stratospheric aerosol climate records developed in the framework of the Aerosol_cci project, one of the 14 parallel projects from the ESA Climate Change Initiative. These data records were processed from a stratospheric aerosol dataset derived from the GOMOS experiment, using an inversion algorithm optimized for aerosol retrieval, called AerGOM. They provide a suite of aerosol parameters, such as the aerosol extinction coefficient at different wavelengths in the UV–visible range. The extinction record includes the total extinction as well as separate fields for liquid sulfate aerosols and polar stratospheric clouds (PSCs). Several additional fields (PSC flag, etc.) are also provided. The resulting stratospheric aerosol dataset, which spans the whole duration of the GOMOS mission (2002 − 2012), was validated using different reference datasets (lidar and balloon profiles).
In the present paper, the emphasis is put on the extinction records. After a thorough analysis of the original AerGOM dataset, we describe the methodology used to construct the gridded CCI-GOMOS dataset and the resulting improvements on both the AerGOM algorithm and the binning procedure, in terms of spatio-temporal resolution, coverage and data quality.
The extinction datasets were validated using lidar profiles from three ground-based stations (Mauna Loa, Garmisch-Partenkirchen, Dumont d'Urville). The median difference of the CCI-GOMOS (Level 3) extinction and ground-based lidar profiles is between ~ 15% and ~ 45% in the 16–21 km altitude range, depending on the considered site and aerosol type.
The CCI-GOMOS dataset was subsequently used, together with a MIPAS SO2time series, to update a volcanic eruption inventory published previously, thus providing a more comprehensive list of eruptions for the ENVISAT period (2002–2012). The number of quantified eruptions increases from 102 to 230 in the updated inventory. This new inventory was used to simulate the evolution of the global radiative forcing by application of the EMAC chemistry-climate model. Results of this simulation improve the agreement between modelled global radiative forcing of stratospheric aerosols at about 100 hPa compared to values estimated from observations. Medium eruptions like the ones of Soufriere Hills/Rabaul (2006), Sarychev (2009) and Nabro (2011) cause a forcing change from about − 0.1 W/m2 to − 0.2 W/m2.
We report on 10 yr of airborne measurements of atmospheric CO2 mole fraction from continuous and flask systems, collected between 2002 and 2012 over the Atmospheric Radiation Measurement Program Climate Research Facility in the US Southern Great Plains (SGP). These observations were designed to quantify trends and variability in atmospheric mole fraction of CO2and other greenhouse gases with the precision and accuracy needed to evaluate ground-based and satellite-based column CO2 estimates, test forward and inverse models, and help with the interpretation of ground-based CO2 mole-fraction measurements. During flights, we measured CO2 and meteorological data continuously and collected flasks for a rich suite of additional gases: CO2, CO, CH4, N2O, 13CO2, carbonyl sulfide (COS), and trace hydrocarbon species. These measurements were collected approximately twice per week by small aircraft (Cessna 172 initially, then Cessna 206) on a series of horizontal legs ranging in altitude from 460 m to 5500 m a.m.s.l. Since the beginning of the program, more than 400 continuous CO2 vertical profiles have been collected (2007–2012), along with about 330 profiles from NOAA/ESRL 12-flask (2006–2012) and 284 from NOAA/ESRL 2-flask (2002–2006) packages for carbon cycle gases and isotopes. Averaged over the entire record, there were no systematic differences between the continuous and flask CO2 observations when they were sampling the same air, i.e., over the one-minute flask-sampling time. Using multiple technologies (a flask sampler and two continuous analyzers), we documented a mean difference of < 0.2 ppm between instruments. However, flask data were not equivalent in all regards; horizontal variability in CO2 mole fraction within the 5–10 min legs sometimes resulted in significant differences between flask and continuous measurement values for those legs, and the information contained in fine-scale variability about atmospheric transport was not captured by flask-based observations. The CO2 mole fraction trend at 3000 m a.m.s.l. was 1.91 ppm yr−1 between 2008 and 2010, very close to the concurrent trend at Mauna Loa of 1.95 ppm yr−1. The seasonal amplitude of CO2 mole fraction in the free troposphere (FT) was half that in the planetary boundary layer (PBL) (~ 15 ppm vs. ~ 30 ppm) and twice that at Mauna Loa (approximately 8 ppm). The CO2 horizontal variability was up to 10 ppm in the PBL and less than 1 ppm at the top of the vertical profiles in the FT.
The three most dominant long-lived greenhouse gases (LLGHG) contributing to climate forcing are, in decreasing order: carbon dioxide (CO2), methane (CH4), and nitrous oxide (N2O). In 1958 systematic measurements of CO2 began at Mauna Loa, Hawaii (MLO), and the atmospheric CO2 abundance was ~315 ppm (parts per million in dry air). In 2016, MLO annual average CO2 reached 404.2 ± 0.1 ppm (www.esrl.noaa.gov/gmd/ccgg/trends) while global average CO2 at Earth’s surface was 402.9 ± 0.1 ppm (Fig. 2.44a).
Clear-sky MLO “apparent” solar transmission (AT) in 2014 remained just below levels for the cleanest background period within the record (1958–62; Fig. 2.35a). Solar radiation provides the energy that drives Earth’s climate and weather. Earth’s radiation budget is the balance of incoming solar radiation and outgoing thermal radiation that is determined by Earth’s surface and atmosphere, in particular clouds and aerosols. NOAA’s Global Monitoring Division has maintained one of the longest continuous records of solar transmission at the Mauna Loa Observatory (MLO) in Hawaii. Because of the observatory’s remote Pacific location and high elevation above local influences (3.4 km), the solar transmission represents the free troposphere and above.
The method of flame scintillation spectral analysis has been adopted for the determination of the size distribution of sodium-containing particles. Near the seashore, these aerosols are identical to sea salt particles, amount to approximately 5% of the total Aitken particle count, and exhibit a power law distribution with β = 3.8. Measurements made at Mauna Loa Observatory (above the trade wind inversion) indicate a smaller size distribution. However, only about 1% of the concentration is transported through the inversion, and removal efficiency tends to favor the removal of larger particles.
The capability of IASI (Infrared Atmospheric Sounder Interferometer) for retrieving OCS has been assessed with a series of retrieval experiments, which have been carried out with a physical forward/inverse scheme, which can exploit the full IASI information content. We use random projections to reduce the dimensionality of the data space and to have a unified treatment of instrument and forward model errors. The OCS column amount is retrieved both by using a scaling parameterization of the profile and a non-parametric approach, in which we first derive the OCS profile and then its global amount is estimated by a proper integration over the profile. IASI OCS retrievals are compared to in situ flask observations at the Mauna Loa validation station, Hawaii, USA and observations from HIAPER Pole-to-Pole flights. We have found that the best way to retrieve OCS is through the non-parametric approach, which shows that the OCS cycle amplitude, phase and mean abundance can be retrieved with high accuracy for night and day time soundings. In fact, IASI captures the OCS seasonal cycle, with an overall difference with in situ observations, which is of the order of ≈ 1 pptv, provided we use HITRAN2012 OCS line compilation. HITRAN2008, which has been used in previous studies, is indeed affected by spectroscopic errors as far as OCS is concerned, which results in heavily biased OCS retrievals. Although the present paper is mostly intended to assess IASI retrievals over ocean, a demonstrative application to above land surface is considered as well. Preliminary results suggest that IASI can recover the OCS cycle in ecosystems governed by leaf and/or soil sources/sinks.
We demonstrate the ability of atmospheric radon concentrations to reliably and unambiguously identify local and remote terrestrial influences on an air mass, and thereby the potential for alteration of trace gas composition by anthropogenic and biogenic processes. Based on high accuracy (lower limit of detection 10–40 mBq m–3), high temporal resolution (hourly) measurements of atmospheric radon concentration we describe, apply and evaluate a simple two-step method for identifying and characterising constituent mole fractions in baseline air. The technique involves selecting a radon-based threshold concentration to identify the “cleanest” (least terrestrially influenced) air masses, and then performing an outlier removal step based on the distribution of constituent mole fractions in the identified clean air masses. The efficacy of this baseline selection technique is tested at three contrasting WMO GAW stations: Cape Grim (a coastal low-altitude site), Mauna Loa (a remote high-altitude island site), and Jungfraujoch (a continental high-altitude site). At Cape Grim and Mauna Loa the two-step method is at least as effective as more complicated methods employed to characterise baseline conditions, some involving up to nine steps. While it is demonstrated that Jungfraujoch air masses rarely meet the baseline criteria of the more remote sites, a selection method based on a variable monthly radon threshold is shown to produce credible “near baseline” characteristics. The seasonal peak-to-peak amplitude of recent monthly baseline CO2 mole fraction deviations from the long-term trend at Cape Grim, Mauna Loa and Jungfraujoch are estimated to be 1.1, 6.0 and 8.1 ppm, respectively.
We analyze monthly tropical near surface air temperature and Mauna Loa Observatory carbon
dioxide (CO2) data within 1960–2016 to identify different carbon cycle responses for two El Nino
types: El Ninos originating in the central tropical Pacific (CP El Nino) and El Ninos originating in the
eastern tropical Pacific (EP El Nino). We find significant differences between the two types of El Nino
events with respect to time delay of the CO2 rise rate that follows the increase in tropical near surface
air temperatures caused by El Nino events. The average time lag of the CP El Nino is 4.0 ±1.7
months, while the mean time lag of EP El Nino is found to be 8.5±2.3 months. The average lag of all
considered 1960–2016 El Ninos is 5.2±2.7 months. In contrast the sensitivity of the CO2 growth rate
to tropical near surface air temperature increase is determined to be about the same for both ElNino
types equal to 2.8±0.9 ppm yr−1K−1 (or 5.9±1.9 GtC yr−1K−1). Our results should be useful for the
understanding of the carbon cycle and constraining it in climate models.
Currently many ground-based atmospheric stations include in-situ measurements of aerosol physical and optical properties, resulting in more than 20 long-term (> 10 yr) aerosol measurement sites in the Northern Hemisphere and Antarctica. Most of these sites are located at remote locations and monitor the aerosol particle number concentration, wavelength-dependent light scattering, backscattering, and absorption coefficients. The existence of these multi-year datasets enables the analysis of long-term trends of these aerosol parameters, and of the derived light scattering Ångström exponent and backscatter fraction. Since the aerosol variables are not normally distributed, three different methods (the seasonal Mann-Kendall test associated with the Sen's slope, the generalized least squares fit associated with an autoregressive bootstrap algorithm for confidence intervals, and the least-mean square fit applied to logarithms of the data) were applied to detect the long-term trends and their magnitudes. To allow a comparison among measurement sites, trends on the most recent 10 and 15 yr periods were calculated. No significant trends were found for the three continental European sites. Statistically significant trends were found for the two European marine sites but the signs of the trends varied with aerosol property and location. Statistically significant decreasing trends for both scattering and absorption coefficients (mean slope of −2.0% yr−1) were found for most North American stations, although positive trends were found for a few desert and high-altitude sites. The difference in the timing of emission reduction policy for the Europe and US continents is a likely explanation for the decreasing trends in aerosol optical parameters found for most American sites compared to the lack of trends observed in Europe. No significant trends in scattering coefficient were found for the Arctic or Antarctic stations, whereas the Arctic station had a negative trend in absorption coefficient. The high altitude Pacific island station of Mauna Loa presents positive trends for both scattering and absorption coefficients.
Abstract. In order to assess the evolution of aerosol parameters affecting climate change, a long-term trend analysis of aerosol optical properties was performed on time series from 52 stations situated across five continents. The time series of measured scattering, backscattering and absorption coefficients as well as the derived single scattering albedo, backscattering fraction, scattering and absorption Ångström exponents covered at least 10 years and up to 40 years for some stations. The non-parametric seasonal Mann–Kendall (MK) statistical test associated with several pre-whitening methods and with Sen's slope was used as the main trend analysis method. Comparisons with general least mean square associated with autoregressive bootstrap (GLS/ARB) and with standard least mean square analysis (LMS) enabled confirmation of the detected MK statistically significant trends and the assessment of advantages and limitations of each method. Currently, scattering and backscattering coefficient trends are mostly decreasing in Europe and North America and are not statistically significant in Asia, while polar stations exhibit a mix of increasing and decreasing trends. A few increasing trends are also found at some stations in North America and Australia. Absorption coefficient time series also exhibit primarily decreasing trends. For single scattering albedo, 52 % of the sites exhibit statistically significant positive trends, mostly in Asia, eastern/northern Europe and the Arctic, 22 % of sites exhibit statistically significant negative trends, mostly in central Europe and central North America, while the remaining 26 % of sites have trends which are not statistically significant. In addition to evaluating trends for the overall time series, the evolution of the trends in sequential 10-year segments was also analyzed. For scattering and backscattering, statistically significant increasing 10-year trends are primarily found for earlier periods (10-year trends ending in 2010–2015) for polar stations and Mauna Loa. For most of the stations, the present-day statistically significant decreasing 10-year trends of the single scattering albedo were preceded by not statistically significant and statistically significant increasing 10-year trends. The effect of air pollution abatement policies in continental North America is very obvious in the 10-year trends of the scattering coefficient – there is a shift to statistically significant negative trends in 2009–2012 for all stations in the eastern and central USA. This long-term trend analysis of aerosol radiative properties with a broad spatial coverage provides insight into potential aerosol effects on climate changes.
Extracting globally representative trend information from lower tropospheric ozone observations is extremely difficult due to the highly variable distribution and interannual variability of ozone, and the ongoing shift of ozone precursor emissions from high latitudes to low latitudes. Here we report surface ozone trends at 27 globally distributed remote locations (20 in the Northern Hemisphere, 7 in the Southern Hemisphere), focusing on continuous time series that extend from the present back to at least 1995. While these sites are only representative of less than 25% of the global surface area, this analysis provides a range of regional long-term ozone trends for the evaluation of global chemistry-climate models. Trends are based on monthly mean ozone anomalies, and all sites have at least 20 years of data, which improves the likelihood that a robust trend value is due to changes in ozone precursor emissions and/or forced climate change rather than naturally occurring climate variability. Since 1995, the Northern Hemisphere sites are nearly evenly split between positive and negative ozone trends, while 5 of 7 Southern Hemisphere sites have positive trends. Positive trends are in the range of 0.5-2 ppbv decade-1, with ozone increasing at Mauna Loa by roughly 50% since the late 1950s. Two high elevation Alpine sites, discussed by previous assessments, exhibit decreasing ozone trends in contrast to the positive trend observed by IAGOS commercial aircraft in the European lower free-troposphere. The Alpine sites frequently sample polluted European boundary layer air, especially in summer, and can only be representative of lower free tropospheric ozone if the data are carefully filtered to avoid boundary layer air. The highly variable ozone trends at these 27 surface sites are not necessarily indicative of free tropospheric trends, which have been overwhelmingly positive since the mid-1990s, as shown by recent studies of ozonesonde and aircraft observations.
We present some results of our initial optical observations of the El Chichon volcanic cloud. These observations were made at the Geophysical Monitoring for Climatic Change Mauna Loa Observatory, Hawaii, and consist of lidar profiles, optical thickness, spectral variation in optical thickness and changes in global and direct solar broadband fluxes. Particle size distribution and cloud mass information contained in the optical thickness observations are discussed. It is clear that the atmospheric radiative effects of the El Chichon cloud far exceed the effects of all other volcanic clouds observed at Mauna Loa since observations were begun in 1958.
Carbon dioxide (CO2 ), methane (CH4 ), and nitrous oxide (N2 O), in decreasing order, are the most dominant long-lived greenhouse gases (LLGHG) contributing to climate forcing. Systematic measurements of CO2 began at Mauna Loa, Hawaii (MLO), in 1958, when the atmospheric mole fraction was ~315 ppm (parts per million in dry air). In 2015 the MLO annual average mole fraction of CO2 exceeded 400 ppm (400.8 ± 0.1 ppm) for the first time (www.esrl .noaa.gov/gmd/ccgg/trends/), while the global average CO2 mole fraction at Earth’s surface was 399.4 ± 0.1 ppm (Fig. 2.40a, www.esrl.noaa.gov/gmd/ccgg /trends/global.html).
Carbon dioxide (CO2) is the dominant long-lived greenhouse gas (LLGHG) contributing to climate forcing; since 1750 its radiative forcing has increased by 1.88 W m-2 or ~65% of the increased forcing by all LLGHGs (see http://www.esrl.noaa.gov/gmd/aggi/aggi.html). When systematic CO2 measurements began at
Mauna Loa, Hawaii, (MLO) in 1958, the annual mean mole fraction was ~315 parts per million (ppm). In May 2013 daily-averaged CO2 at MLO exceeded 400 ppm for the first time (see http://www.esrl.noaa.gov/gmd/ccgg/trends/index.html). This 27% increase is mainly due to a fourfold rise in anthropogenic CO2 emissions from fossil fuel combustion and cement production. The CO2 growth rate has correspondingly increased from 0.7 ppm yr-1 in the early 1960s to 2.1 ppm yr-1 during the last decade. About half of the CO2 emitted remains in the atmosphere; the rest is taken up by the oceans and terrestrial biosphere. The annual atmospheric increase varies considerably from year to year, ranging from 0.7 ± 0.1 to 2.8 ± 0.1 ppm yr-1 since 1990. This is explained largely by variations in natural fluxes influenced by the phase of ENSO (Bastos et al. 2013). In 2013 the globally averaged CO2 mole fraction at Earth’s surface was 395.3 ± 0.1 ppm (Fig. 2.32a), an increase of 2.8 ± 0.1 ppm over the 2012 mean.
The three long-lived greenhouse gases (LLGHGs) with the largest contributions to climate forcing are, in decreasing order: carbon dioxide (CO2), methane (CH4), and nitrous oxide (N2O). Systematic measurements of CO2 began at Mauna Loa, Hawaii (MLO) in 1958, when the atmospheric CO2 abundance was ~315 ppm (parts per million in dry air). In 2017, MLO annually averaged CO2 reached 406.5 ± 0.1 ppm (www.esrl.noaa.gov/gmd/ccgg/trends/; all uncertainties are 68% confidence intervals, unless noted otherwise), while preliminary globally averaged CO2 at Earth’s surface was 405.0 ± 0.1 ppm (Fig. 2.45a, see www.esrl.noaa.gov/gmd/ccgg/trends/global.html).
Carbon dioxide (CO2) is the dominant long-lived greenhouse gas (LLGHG) contributing to climate forcing. The increase in radiative forcing since 1750 due to the increased global atmospheric burden of CO2 was 1.91 W m−2 in 2014 (see www.esrl.noaa .gov/gmd/aggi/aggi.html). In 1958, when systematic measurements of CO2 began at Mauna Loa, Hawaii (MLO), the atmospheric mole fraction was ~315 ppm (parts per million in dry air). In May 2013 daily averaged CO2 at MLO surpassed 400 ppm for the first time (see www.esrl.noaa.gov/gmd/ccgg/trends/index .html). In 2014 the annual average at MLO was 398.6 ± 0.1 ppm and monthly averaged CO2 mole fractions exceeded 400 ppm for April, May, and June. The global average CO2 mole fraction at Earth’s surface in 2014 was 397.2 ± 0.1 ppm (Fig. 2.36a), an increase of 1.9 ppm over the 2013 global mean.
Methane measurements, radon measurements, and air mass trajectories calculated for Mauna Loa Observatory (MLO) are examined to determine relationships among methane source/sink regions, flow patterns for MLO, and methane variations on the synoptic-to-seasonal scale. We present evidence that the methane seasonal cycle observed at MLO is in large part driven by seasonal variations in transport. Furthermore, the variability in methane mixing ratio at MLO is higher in winter than in summer because of greater variability in flow patterns. Ten-day back trajectories are classified according to wind speed and direction using cluster analysis to determine six typical transport regimes. The methane data are then grouped according to transport cluster. The median methane mixing ratio corresponding to tradewind flow was 17.2 ppbv (parts per billion by volume) lower than that corresponding to strong westerly flow. This difference is attributed to transport from source/sink regions, flow across the methane latitudinal gradient, and seasonality of flow patterns. Case studies utilizing individual trajectories and radon measurements to determine probable air parcel origins illustrate the effects of long-range transport on the methane mixing ratio at MLO. Changes in flow pattern from sink to source origins can result in a 50 ppbv rise in methane mixing ratio over a period of a few days. During winter, alternation of westerly winds, tradewinds and anticyclonically curving flows contributes to the large variability in the methane mixing ratio. During summer this variability is reduced with the cessation of strong westerly flows from methane source regions. In July and August, air parcels originate far from methane source regions and in the area of highest modeled OH concentration. At the same time, methane mixing ratios decrease to the lowest values for the year. In this way, the seasonality of flow patterns exerts a major influence on the observed seasonal cycle of methane at MLO.
The stratospheric aerosol layer has been monitored with lidars at Mauna Loa Observatory in Hawaii and Boulder in Colorado since 1975 and 2000, respectively. Following the Pinatubo volcanic eruption in June 1991, the global stratosphere has not been perturbed by a major volcanic eruption providing an unprecedented opportunity to study the background aerosol. Since about 2000, an increase of 4-7 % per year in the aerosol backscatter in the altitude range 20-30 km has been detected at both Mauna Loa and Boulder. This increase is superimposed on a seasonal cycle with a winter maximum that is modulated by the quasibiennial oscillation (QBO) in tropical winds. Of the three major causes for a stratospheric aerosol increase: volcanic emissions to the stratosphere, increased tropical upwelling, and an increase in anthropogenic sulfur gas emissions in the troposphere, it appears that a large increase in coal burning since 2002, mainly in China, is the likely source of sulfur dioxide that ultimately ends up as the sulfate aerosol responsible for the increased backscatter from the stratospheric aerosol layer. The results are consistent with 0.6-0.8% of tropospheric sulfur entering the stratosphere.
Carbon dioxide is increasing in the atmosphere and is of considerable concern in global climate change because of its greenhouse gas warming potential. The rate of increase has accelerated since measurements began at Mauna Loa Observatory in 1958 where carbon dioxide increased from less than 1 part per million per year (ppm yr?1) prior to 1970 to more than 2 ppm yr?1 in recent years. Here we show that the anthropogenic component (atmospheric value reduced by the pre-industrial value of 280 ppm) of atmospheric carbon dioxide has been increasing exponentially with a doubling time of about 30 years since the beginning of the industrial revolution (1800). Even during the 1970s, when fossil fuel emissions dropped sharply in response to the �oil crisis� of 1973, the anthropogenic atmospheric carbon dioxide level continued increasing exponentially at Mauna Loa Observatory. Since the growth rate (time derivative) of an exponential has the same characteristic lifetime as the function itself, the carbon dioxide growth rate is also doubling at the same rate. This explains the observation that the linear growth rate of carbon dioxide has more than doubled in the past 40 years. The accelerating growth rate is simply the outcome of exponential growth in carbon dioxide with a nearly constant doubling time of about 30 years (about 2%/yr) and appears to have tracked human population since the pre-industrial era.
The carbon monoxide (CO) concentrations observed at Mt. Waliguan in China (WLG), Ulaan Uul in Mongolia (UUM), Tae-ahn Peninsula in Korea (TAP) and Ryori in Japan (RYO) were analysed between 1991 and 2008. The average annual concentration of CO, a toxic air pollutant, was the highest at TAP (235±44 ppb), followed by RYO (169±35 ppb), UUM (154±27 ppb) and WLG (138±24 ppb). These data obtained in East Asia were also compared with CO data from Mauna Loa, Hawaii. CO tends to be highest in spring and lowest in summer in East Asia, with the exception of WLG. TAP had the highest CO concentrations in all seasons compared with WLG, UUM and RYO, and displays a wide short-term variability in concentration. This is caused by large-scale air pollution owing to its downwind location, close to continental East Asia. CO concentrations observed at TAP were analysed as follows: according to the origin of the isentropic backward trajectory and its transport passage; as continental background airflows (CBG); regionally polluted continental airflows (RPC); oceanic background airflows (OBG); and partly perturbed oceanic airflows (PPO). The high concentrations of CO at TAP are because of the airflow originating from the East Asian continent, rather than the North Pacific. RPCs, which pass through eastern China, appear to have high CO concentrations in spring, autumn and winter. It is noteworthy that the overall trend at TAP does not show an increase despite the fact that energy use in China approximately doubled from 1991 to 2008. OBGs, however, are affected by North Pacific air masses with low CO concentrations in summer.
Discrete air sample measurements of atmospheric methane (CH4) were analyzed at the following East Asian monitoring sites: Mt. Waliguan (WLG), China; Ulaan Uul (UUM), Mongolia; Tae-ahn Peninsula (TAP), Korea; and the remote high-altitude site, Mauna Loa (MLO), Hawaii, for 1991 similar to 2013. The changes of CH4 emission from regional sources resulted in a trend in the difference between the East Asian monitoring sites and MLO. The average annual growth rate in the difference between TAP and MLO has a larger 1 sigma uncertainty of the trend of 0.3 ppb year(-1) compared with WLG and UUM. TAP is influenced by changes in regional sources. Therefore, the annual increase varies greatly from year to year. The East Asian monitoring sites show a different seasonal cycle. The average seasonal variation at TAP has higher standard deviation in July and August. During July and August, there is inflow of air depleted in CH4 by OH radical over the North Pacific Ocean as well as very high CH4 from paddy field in eastern China. The average annual growth rate in the difference between TAP and MLO was increasing with 1.4 +/- 1.2 ppb year(-1) for the regional polluted continental (RPC) air mass originating from China.
Ozone trends, derived from 1979-1996 Dobson spectrophotometer total ozone data obtained at five U.S. mainland midlatitude stations, averaged -3.4, -4.9, -2.6, -1.9, and -3.3%/decade for winter, spring, summer, and autumn months, and on an annual basis, respectively. At the lower latitude stations of Mauna Loa and Samoa, corresponding-period annual ozone trends were -0.4 and -1.3%/decade, respectively, while at Huancayo, Peru, the 1979-1991 annual trend was -0.9%/decade. A linear trend approximation to ozone changes that occurred since 1978 during austral daylight times at Amundsen-Scott (South Pole) station, Antarctica, yielded a value of -12%/decade. By combining 1979-1996 annual trend data for three U.S. mainland stations with trends for the sites derived from 1963-1978 data, it is estimated that the ozone decrease at U.S. midlatitudes through 1996, relative to ozone present in the mid-1960s, was -6.7%. Similar analyses incorporating South Pole data obtained since 1963 yielded an ozone change at South Pole (daylight observations) through 1996 of approximately -25%. South Pole October total ozone values in 1996 were lower than mid-1960s October ozone values by a factor of two. Trend data are also presented for several shorter record period stations, including the foreign cooperative stations of Haute Provence, France; Lauder, New Zealand; and Perth, Australia.
We present a description of the NASA Aura Tropospheric Emission Spectrometer (TES) carbonyl sulfide (OCS) retrieval algorithm for oceanic observations, along with evaluation of the biases and uncertainties using aircraft profiles from the HIPPO (HIAPER Pole-to-Pole Observations) campaign and data from the NOAA Mauna Loa site. In general, the OCS retrievals (1) have less than 1.0 degree of freedom for signals (DOFs), (2) are sensitive in the mid-troposphere with a peak sensitivity typically between 300 and 500 hPa, (3) but have much smaller systematic errors from temperature, CO2 and H2O calibrations relative to random errors from measurement noise. We estimate the monthly means from TES measurements averaged over multiple years so that random errors are reduced and useful information about OCS seasonal and latitudinal variability can be derived. With this averaging, TES OCS data are found to be consistent (within the calculated uncertainties) with NOAA ground observations and HIPPO aircraft measurements. TES OCS data also captures the seasonal and latitudinal variations observed by these in situ data.
Increases in atmospheric greenhouse gas burdens, especially the long-lived greenhouse gases
(LLGHGs) carbon dioxide (CO2), methane (CH4), and nitrous oxide (N2O), are mainly the result
of human activity since the industrial revolution and largely responsible for increasing global
temperature (IPCC 2013).
The atmospheric pre-industrial abundance of CO2 is estimated to be ~278 ppm (parts per million
by moles in dry air), based on air extracted from ice in Greenland and Antarctica (Etheridge
et al. 1996). Systematic measurements of atmospheric CO2 began at Mauna Loa, Hawaii (MLO), in
1958, when the atmospheric CO2 abundance was about 315 ppm. In 2019, annually averaged CO2
at MLO reached 411.4 ± 0.1 ppm (all uncertainties are 68% confidence intervals), while globally
averaged CO2 at Earth’s surface was 409.8 ± 0.1 ppm (Fig. 2.46a).
Annual growth in global mean CO2 has risen steadily from 0.6 ± 0.1 ppm yr−1 in the early 1960s
to an average of 2.3 ppm yr−1 during 2009–18, with large interannual variability (Fig. 2.46a). The
increase in global mean CO2 from 2018 to 2019 was 2.5 ± 0.1 ppm (Table 2.8).
A potent greenhouse gas and biological irritant, tropospheric ozone is also the primary source of atmospheric hydroxyl radicals, which remove numerous hazardous trace gases from the atmosphere. Tropospheric ozone levels have increased in spring at remote sites in the mid-latitudes of the Northern Hemisphere over the past few decades; this increase has been attributed to a growth in Asian precursor emissions. In contrast, 40 years of continuous measurements at Mauna Loa Observatory in Hawaii reveal little change in tropospheric ozone levels during spring (March–April), but a rise in autumn (September–October). Here we examine the contribution of decadal shifts in atmospheric circulation patterns to decadal variability in tropospheric ozone levels at Mauna Loa using a suite of chemistry–climate model simulations. We show that the flow of ozone-rich air from Eurasia towards Hawaii during spring weakened in the 2000s as a result of La-Niña-like decadal cooling in the eastern equatorial Pacific Ocean. During autumn, in contrast, the flow of ozone-rich air from Eurasia to Hawaii strengthened in the mid-1990s onwards, coincident with the positive phase of the Pacific–North American pattern. We suggest that these shifts in atmospheric circulation patterns can reconcile observed trends in tropospheric ozone levels at Mauna Loa and the northern mid-latitudes in recent decades. We conclude that decadal variability in atmospheric circulation patterns needs to be considered when attributing observed changes in tropospheric ozone levels to human-induced trends in precursor emissions.
The standard technique for computing total column ozone from a balloonsonde measurement includes an extrapolation of the measured ozone profile to altitudes above the balloon burst altitude. This total column calculation can be improved by using a monthly average ozone climatology based on ozone profile measurements from the solar backscattered ultraviolet instrument on the Nimbus 7 satellite. For each month and 10° latitude zone we provide the column ozone above 30 distinct pressure levels in the middle and upper atmosphere (from 1 through 30 mbar) that can be added to the measured balloon profile. Use of this climatology reduces the uncertainty in the column ozone estimate when the sonde data are compared with simultaneous Dobson observations at Boulder and at Mauna Loa.
Aerosol optical depth (AOD) has been measured at the Atmospheric Radiation Measurement Program central facility near Lamont, Oklahoma, since the fall of 1992. Most of the data presented are from the multifilter rotating shadowband radiometer, a narrow-band, interference-filter Sun radiometer with five aerosol bands in the visible and near infrared; however, AOD measurements have been made simultaneously and routinely at the site by as many as three different types of instruments, including two pointing Sun radiometers. Scatterplots indicate high correlations and small biases consistent with earlier comparisons. The early part of this 16 year record had a disturbed stratosphere with residual Mt. Pinatubo aerosols, followed by the cleanest stratosphere in decades. As such, the last 13 years of the record reflect changes that have occurred predominantly in the troposphere. The field calibration technique is briefly described and compared to Langley calibrations from Mauna Loa Observatory. A modified cloud-screening technique is introduced that increases the number of daily averaged AODs retrieved annually to about 250 days compared with 175 days when a more conservative method was employed in earlier studies. AODs are calculated when the air mass is less than six; that is, when the Sun's elevation is greater than 9.25°. The more inclusive cloud screen and the use of most of the daylight hours yield a data set that can be used to more faithfully represent the true aerosol climate for this site. The diurnal aerosol cycle is examined month-by-month to assess the effects of an aerosol climatology on the basis of infrequent sampling such as that from satellites.
The Montreal Protocol was designed to protect the stratospheric ozone layer by enabling reductions in the abundance of ozone-depleting substances such as chlorofluorocarbons (CFCs) in the atmosphere1,2,3. The reduction in the atmospheric concentration of trichlorofluoromethane (CFC-11) has made the second-largest contribution to the decline in the total atmospheric concentration of ozone-depleting chlorine since the 1990s1. However, CFC-11 still contributes one-quarter of all chlorine reaching the stratosphere, and a timely recovery of the stratospheric ozone layer depends on a sustained decline in CFC-11 concentrations1. Here we show that the rate of decline of atmospheric CFC-11 concentrations observed at remote measurement sites was constant from 2002 to 2012, and then slowed by about 50 per cent after 2012. The observed slowdown in the decline of CFC-11 concentration was concurrent with a 50 per cent increase in the mean concentration difference observed between the Northern and Southern Hemispheres, and also with the emergence of strong correlations at the Mauna Loa Observatory between concentrations of CFC-11 and other chemicals associated with anthropogenic emissions. A simple model analysis of our findings suggests an increase in CFC-11 emissions of 13 ± 5 gigagrams per year (25 ± 13 per cent) since 2012, despite reported production being close to zero4 since 2006. Our three-dimensional model simulations confirm the increase in CFC-11 emissions, but indicate that this increase may have been as much as 50 per cent smaller as a result of changes in stratospheric processes or dynamics. The increase in emission of CFC-11 appears unrelated to past production; this suggests unreported new production, which is inconsistent with the Montreal Protocol agreement to phase out global CFC production by 2010.
DIRECT LINK:
https://urldefense.proofpoint.com/v2/url?u=http-3A__em.rdcu.be_wf_click-3Fupn-3DlMZy1lernSJ7apc5DgYM8YZ4EH2BrPAJw2pbkJV8BKI-2D3D-5F5xu02FVv-2D2BCbxTLHpBsC0ReR0Lk2n3zAnLF49yZgrFurR-2D2BFiqH1-2D2FMFKG8btZzzGWrcxMGzjHiwFFXD7asK3YM2sMWkC-2D2BNwOH5bqDWsLCu4srEhweiMrVZs9Sexiu-2D2FX9OEbA73CxO3h2gQXHJHE40lLNbKOuof-2D2FTIjvYcLxa9DSWPXj7B9CC-2D2BjqKOEnaj-2D2F26E8rW7gW-2D2B8G2ultmm61Y8RrIerKDRyWo5L8Aki4xc8qS2lgqFFDjYNOg0di-2D2Br4bVWjenm4Dvh04KBakY8l45KQV7Q-2D3D-2D3D&d=DwMDaQ&c=JnBkUqWXzx2bz-3a05d47Q&r=HDR226l5csRq7Ff5bwZ0rAuVSl7y7kA6F_PSHoAixr0&m=xf1432XARDC27hf8BZPoQjQ6xLJBSK1KZMK1OfgFZ-0&s=ajDOAHRCfw0jdJTveIWD67eAA9M5Rzsf3_Fa-PrXSz8&e=
The long-term evolution of stratospheric ozone at different stations in the low and mid-latitudes is investigated. The analysis is performed by comparing the collocated profiles of ozone lidars, at the northern mid-latitudes (Meteorological Observatory Hohenpeißenberg, Haute-Provence Observatory, Tsukuba and Table Mountain Facility), tropics (Mauna Loa Observatory) and southern mid-latitudes (Lauder), with ozonesondes and space-borne sensors (SBUV(/2), SAGE II, HALOE, UARS MLS and Aura MLS), extracted around the stations. Relative differences are calculated to find biases and temporal drifts in the measurements. All measurement techniques show their best agreement with respect to the lidar at 20–40 km, where the differences and drifts are generally within ±5% and ±0.5% yr−1, respectively, at most stations. In addition, the stability of the long-term ozone observations (lidar, SBUV(/2), SAGE II and HALOE) is evaluated by the cross-comparison of each data set. In general, all lidars and SBUV(/2) exhibit near-zero drifts and the comparison between SAGE II and HALOE shows larger, but insignificant drifts. The RMS of the drifts of lidar and SBUV(/2) is 0.22 and 0.27% yr−1, respectively at 20–40 km. The average drifts of the long-term data sets, derived from various comparisons, are less than ±0.3% yr−1 in the 20–40 km altitude at all stations. A combined time series of the relative differences between SAGE II, HALOE and Aura MLS with respect to lidar data at six sites is constructed, to obtain long-term data sets lasting up to 27 years. The relative drifts derived from these combined data are very small, within ±0.2% yr−1.
We present measurements from the Water Vapor Millimeter-wave Spectrometer (WVMS) instruments at Table Mountain, California (34.4°N, 242.3°E), and Mauna Loa, Hawaii (19.5°N, 204.4°E), and highlight the extended altitude range of the measurements at these sites, which now provide measurements down to 26 km. We show that this extended altitude range has been acquired without disturbing the existing long-term WVMS data set at Mauna Loa. Validation of the successful transition is provided by comparing WVMS measurements with coincident satellite measurements from the Aura Microwave Limb Sounder (MLS), the Atmospheric Chemistry Experiment, and the Michelson Interferometer for Passive Atmospheric Sounding. At the lowest altitudes where WVMS measurements are possible, we also compare with frost-point hygrometer balloon measurements. The water vapor mixing ratios measured at 50 km over Mauna Loa are the highest ever reported in the WVMS (since 1996) or MLS (since 2004) time series. Particularly encouraging for the new 26 km WVMS measurements is that they indicate an increase between 2010 and 2011 that is comparable to that observed by other instruments. This shows that these measurements are sensitive to variations at this altitude and that the instrumental baseline remains stable.
Mixing of neighboring data points in a sequence is a common, but understudied, effect in physical experiments. This can occur in the measurement apparatus (if material from multiple time points is pulled into a measurement chamber simultaneously, for instance) or the system itself, e.g., via diffusion of isotopes in an ice sheet. We propose a model-free technique to detect this kind of local mixing in time-series data using an information-theoretic technique called permutation entropy. By varying the temporal resolution of the calculation and analyzing the patterns in the results, we can determine whether the data are mixed locally, and on what scale. This can be used by practitioners to choose appropriate lower bounds on scales at which to measure or report data. After validating this technique on several synthetic examples, we demonstrate its effectiveness on data from a chemistry experiment, methane records from Mauna Loa, and an Antarctic ice core.
Water vapor in the subtropical troposphere plays an important role in the radiative balance, the distribution of precipitation, and the chemistry of the Earth's atmosphere. Measurements of the water vapor mixing ratio paired with stable isotope ratios provide unique information on transport processes and moisture sources that is not available with mixing ratio data alone. Measurements of the D/H isotope ratio of water vapor from Mauna Loa Observatory over 4 weeks in October–November 2008 were used to identify components of the regional hydrological cycle. A mixing model exploits the isotope information to identify water fluxes from time series data. Mixing is associated with exchange between marine boundary layer air and tropospheric air on diurnal time scales and between different tropospheric air masses with characteristics that evolve on the synoptic time scale. Diurnal variations are associated with upslope flow and the transition from nighttime air above the marine trade inversion to marine boundary layer air during daytime. During easterly trade wind conditions, growth and decay of the boundary layer are largely conservative in a regional context but contribute ∼12% of the nighttime water vapor at Mauna Loa. Tropospheric moisture is associated with convective outflow and exchange with drier air originating from higher latitude or higher altitude. During the passage of a moist filament, boundary layer exchange is enhanced. Isotopic data reflect the combination of processes that control the water balance, which highlights the utility for baseline measurements of water vapor isotopologues in monitoring the response of the hydrological cycle to climate change.
Carbon monoxide (CO) mixing ratios were measured in air samples collected weekly at eight locations. The air was collected as part of the CMDL/NOAA cooperative flask sampling program (Climate Monitoring and Diagnostics Laboratory, formerly Geophysical Monitoring for Climatic Change, Air Resources Laboratory/National Oceanic and Atmospheric Administration) at Point Barrow, Alaska (71°N), Niwot Ridge, Colorado (40°N), Mauna Loa and Cape Kumakahi, Hawaii (19°N), Guam, Marianas Islands (13°N), Christmas Island (2°N), Ascension Island (8°S) and American Samoa (14°S). Half-liter or 3-L glass flasks fitted with glass piston stopcocks holding teflon O rings were used for sample collection. CO levels were determined within several weeks of collection using gas chromatography followed by mercuric oxide reduction detection, and mixing ratios were referenced against the CMDL/NOAA carbon monoxide standard scale. During the period of study (mid-1988 through December 1990) CO levels were greatest in the high latitudes of the northern hemisphere (mean mixing ratio from January 1989 to December 1990 at Point Barrow was approximately 154 ppb) and decreased towards the south (mean mixing ratio at Samoa over a similar period was 65 ppb). Mixing ratios varied seasonally, the amplitude of the seasonal cycle was greatest in the north and decreased to the south. Carbon monoxide levels were affected by both local and regional scale processes. The difference in CO levels between northern and southern latitudes also varied seasonally. The greatest difference in CO mixing ratios between Barrow and Samoa was observed during the northern winter (about 150 ppb). The smallest difference, 40 ppb, occurred during the austral winter. The annually averaged CO difference between 71°N and 14°S was approximately 90 ppb in both 1989 and 1990; the annually averaged interhemispheric gradient from 71°N to 41°S is estimated as approximately 95 ppb.
Abstract. Retrievals of vertical profiles of key atmospheric gases provide a critical long-term record from ground-based Fourier transform infrared (FTIR) solar absorption measurements. However, the characterization of the retrieved vertical profile structure can be difficult to validate, especially for gases with large vertical gradients and spatial–temporal variability such as water vapor. In this work, we evaluate the accuracy of the most common water vapor isotope (H216O, hereafter WV) FTIR retrievals in the lower and upper troposphere–lower stratosphere. Coincident high-quality vertically resolved WV profile measurements obtained from 2010 to 2016 with balloon-borne NOAA frost point hygrometers (FPHs) are used as reference to evaluate the performance of the retrieved profiles at two sites: Boulder (BLD), Colorado, and at the mountaintop observatory of Mauna Loa (MLO), Hawaii. For a meaningful comparison, the spatial–temporal variability has been investigated. We present results of comparisons among FTIR retrievals with unsmoothed and smoothed FPH profiles to assess WV vertical gradients. Additionally, we evaluate the quantitative impact of different a priori profiles in the retrieval of WV. An orthogonal linear regression analysis shows the best correlation among tropospheric layers using ERA-Interim (ERA-I) a priori profiles and biases are lower for unsmoothed comparisons. In Boulder, we found a negative bias of 0.02±1.9 % (r=0.95) for the 1.5–3 km layer. A larger negative bias of 11.1±3.5 % (r=0.97) was found in the lower free troposphere layer of 3–5 km attributed to rapid vertical change of WV, which is not always captured by the retrievals. The bias improves in the 5–7.5 km layer (1.0±5.3 %, r=0.94). The bias remains at about 13 % for layers above 7.5 km but below 13.5 km. At MLO the spatial mismatch is significantly larger due to the launch of the sonde being farther from the FTIR location. Nevertheless, we estimate a negative bias of 5.9±4.6 % (r=0.93) for the 3.5–5.5 km layer and 9.9±3.7 % (r=0.93) for the 5.5–7.5 km layer, and we measure positive biases of 6.2±3.6 % (r=0.95) for the 7.5–10 km layer and 12.6 % and greater values above 10 km. The agreement for the first layer is significantly better at BLD because the air masses are similar for both FTIR and FPH. Furthermore, for the first time we study the influence of different WV a priori profiles in the retrieval of selected gas profiles. Using NDACC standard retrievals we present results for hydrogen cyanide (HCN), carbon monoxide (CO), and ethane (C2H6) by taking NOAA FPH profiles as the ground truth and evaluating the impact of other WV profiles. We show that the effect is minor for C2H6 (bias <0.5 % for all WV sources) among all vertical layers. However, for HCN we found significant biases between 6 % for layers close to the surface and 2 % for the upper troposphere depending on the WV profile source. The best results (reduced bias and precision and r values closer to unity) are always found for pre-retrieved WV. Therefore, we recommend first retrieving WV to use in subsequent retrieval of gases.
Ambient levels and variability of major atmospheric halocarbons, i.e. CFC-12, CFC-11, CFC-113, CCl4, CH3CCl3, C2HCl3, and C2Cl4 in a major metropolis (Taipei, Taiwan) were re-investigated after fourteen years by flask sampling in 2012. Our data indicates that the variability expressed as standard deviations (SD) of CFC-113 and CCl4 remained small (2.0ppt and 1.9ppt, respectively) for the 10th-90th percentile range in both sampling periods; whereas the variability of CFC-12, CFC-11, C2HCl3, and C2Cl4 measured in 2012 became noticeably smaller than observed in 1998, suggesting their emissions were reduced over time. By comparing with the background data of a global network (NOAA/ESRL/GMD baseline observatories), the ambient levels and distribution of these major halocarbons in Taipei approximated those at a background site (Mauna Loa) in 2012, suggesting that the fingerprint of the major halocarbons in a used-to-be prominent source area has gradually approached to that of the background atmosphere.
Abstract. The Plantower PMS5003 sensors (PA-PMS) used in the PurpleAir (PA) monitor PA-II-SD configuration are equivalent to cell-reciprocal nephelometers using a 657 nm perpendicularly polarized light source that integrates light scattering from 18 to 166 degrees. Yearlong field data at the National Oceanic and Atmospheric Administration’s (NOAA) Mauna Loa Observatory (MLO) and Boulder Table Mountain (BOS) sites show that the 1 h average of the PA-PMS first size channel, labeled “> 0.3 μm” (“CH1”) is highly correlated with submicrometer aerosol scattering coefficients at the 550 nm and 700 nm wavelengths measured by the TSI 3563 integrating nephelometer, from 0.4 Mm−1 to 500 Mm−1. This corresponds to an hourly average submicrometer aerosol mass concentration of approximately 0.2 to 200 ug m−3. A physical-optical model of the PA-PMS is developed to estimate light intensity on the photodiode, accounting for angular truncation as a function of particle size. Predictions are then compared with yearlong fine aerosol size distribution and scattering coefficient field data at the BOS site. It is shown that CH1 is linearly proportional to the model-predicted intensity of the light scattered by particles in the PA-PMS laser to its photodiode over 4 orders of magnitude. This is consistent with CH1 being a measure of the scattering coefficient and not the particle number concentration or particulate matter concentration. Field data at BOS confirm the model prediction that the ratio of CH1 to the scattering coefficient would be highest for aerosols with median scattering diameters < 0.3 μm. The PA-PMS detects aerosols smaller than 0.3 μm diameter in proportion to their contribution to the scattering coefficient. The model predicts that the PA-PMS response to particles > 0.3 μm decreases relative to an ideal nephelometer by about 75 % for particle diameters ≥ 1.0 μm. This is a result of using a laser that is polarized, the angular truncation of the scattered light, and particle loss in the instrument before reaching the laser. The results of this study indicate that the PA-PMS is not an optical particle counter and that its six size fractions are not an accurate representation of particle size distribution. The relationship between the PA-PMS 1 h average CH1 and bsp1, the scattering coefficient in Mm−1 due to particles below 1 μm aerodynamic diameter, at wavelength 550 nanometers, is found to be bsp1 = 0.015 ± 2.07 × 10⁻⁵ × CH1, for relative humidity below 40 %. The coefficient of determination R2 is 0.97. This suggests that the low-cost and widely used PA monitors can be used to measure and predict the aerosol light scattering coefficient in the mid-visible nearly as well as integrating nephelometers.
Abstract. The Plantower PMS5003 sensors (PMS) used in the PurpleAir monitor PA-II-SD configuration (PA-PMS) are equivalent to cell-reciprocal nephelometers using a 657 nm perpendicularly polarized light source that integrates light scattering from 18 to 166∘. Yearlong field data at the National Oceanic and Atmospheric Administration's (NOAA) Mauna Loa Observatory (MLO) and Boulder Table Mountain (BOS) sites show that the 1 h average of the PA-PMS first size channel, labeled “> 0.3 µm” (“CH1”), is highly correlated with submicrometer aerosol scattering coefficients at the 550 and 700 nm wavelengths measured by the TSI 3563 integrating nephelometer, from 0.4 to 500 Mm−1. This corresponds to an hourly average submicrometer aerosol mass concentration of approximately 0.2 to 200 µg m−3. A physical–optical model of the PMS is developed to estimate light intensity on the photodiode, accounting for angular truncation of the volume scattering function as a function of particle size. The model predicts that the PMS response to particles > 0.3 µm decreases relative to an ideal nephelometer by about 75 % for particle diameters ≥ 1.0 µm. This is a result of using a laser that is polarized, the angular truncation of the scattered light, and particle losses (e.g., due to aspiration) before reaching the laser. It is shown that CH1 is linearly proportional to the model-predicted intensity of the light scattered by particles in the PMS laser to its photodiode over 4 orders of magnitude. This is consistent with CH1 being a measure of the scattering coefficient and not the particle number concentration or particulate matter concentration. The model predictions are consistent with data from published laboratory studies which evaluated the PMS against a variety of aerosols. Predictions are then compared with yearlong fine aerosol size distribution and scattering coefficient field data at the BOS site. Field data at BOS confirm the model prediction that the ratio of CH1 to the scattering coefficient would be highest for aerosols with median scattering diameters < 0.3 µm. The PMS detects aerosols smaller than 0.3 µm diameter in proportion to their contribution to the scattering coefficient. The results of this study indicate that the PMS is not an optical particle counter and that its six size fractions are not a meaningful representation of particle size distribution. The relationship between the PMS 1 h average CH1 and bsp1, the scattering coefficient in Mm−1 due to particles below 1 µm aerodynamic diameter, at wavelength 550 nm, is found to be bsp1 = 0.015 ± 2.07 × 10⁻⁵ × CH1, for relative humidity below 40 %. The coefficient of determination r2 is 0.97. This suggests that the low-cost and widely used PA monitors can be used to measure and predict the submicron aerosol light scattering coefficient in the mid-visible nearly as well as integrating nephelometers. The effectiveness of the PA-PMS to serve as a PM2.5 mass concentration monitor is due to both the sensor behaving like an imperfect integrating nephelometer and the mass scattering efficiency of ambient PM2.5 aerosols being roughly constant.
We investigated the variability of the aerosol scattering (σsp; 1974–2015) and absorption (σap; 2000–2015) coefficients at the Mauna Loa Observatory using surface in situ measurements. Although σsp decreased during the morning (1.85 ± 3.43 Mm–1 at 550 nm, 8–11 local standard time [LST]), it increased during the afternoon (3.72 ± 7.63 Mm–1 at 550 nm, 14–17 LST) due to the development of thermally induced boundary layer winds. No distinct diurnal variation was observed in σap. The obvious increase in σsp and σap during the spring under free troposphere conditions (8–11 LST) is attributed to long-range-transported aerosols from Asia, especially dust and pollution aerosols from Northeast Asia and biomass burning aerosols from Southeast Asia. Accordingly, σsp increased from 1974 till 2015 (at 1.89% year–1), whereas no significant trend was noted for either σsp or σap from 2000 till 2015. An increasing trend for σsp prevailed in air masses originating in Northeast Asia (+0.51 Mm–1 decade–1).
Remote sounding methods are used to derive ozone profile and column information from various ground-based and satellite measurements. Vertical ozone profiles measured in Dobson units (DU) are currently retrieved based on laboratory measurements of the ozone absorption cross-section spectrum between 270 and 400 nm published in 1985 by Bass and Paur (BP). Recently, the US National Aeronautics and Space Administration (NASA) and the European Space Agency (ESA) proposed using the set of ozone cross-section measurements made at the Daumont laboratory in 1992 (BDM) for revising the Aura Ozone Monitoring Instrument (OMI) and Global Ozone Monitoring Experiment (GOME) satellite ozone profiles and total ozone column retrievals. Dobson Umkehr zenith sky data have been collected by NOAA ground-based stations at Boulder, CO (BDR) and Mauna Loa Observatory, HI (MLO) since the 1980s. The UMK04 algorithm is based on the BP ozone cross-section data. It is currently used for all Dobson Umkehr data processing submitted to the World Ozone and Ultraviolet radiation Data Centre (WOUDC) under the Global Atmosphere Watch (GAW) program of the World Meteorological Organization (WMO). Ozone profiles are also retrieved from measurements by the Mark IV Brewers operated by the NOAA-EPA Brewer Spectrophotometer UV and Ozone Network (NEUBrew) using a modified UMK04 algorithm (O3BUmkehr v.2.6, Martin Stanek). This paper describes the sensitivity of the Umkehr retrievals with respect to the proposed ozone cross-section changes. It is found that the ozone cross-section choice only minimally (within the retrieval accuracy) affects the Dobson and the Brewer Umkehr retrievals. On the other hand, significantly larger errors were found in the MLO and Boulder Umkehr ozone data (−8 and +5% bias in stratosphere and troposphere respectively) when the out-of-band (OOB) stray light contribution to the Umkehr measurement is not taken into account (correction is currently not included in the UMK04). The vertical distribution of OOB effect in the retrieved profile can be related to the local ozone climatology, instrument degradation, and optical characteristics of the instrument. Nonetheless, recurring OOB errors do not contribute to the long-term ozone trends.
Abstract. The long-term record of Umkehr measurements from four NOAA Dobson spectrophotometers was reprocessed after updates to the instrument calibration procedures. In addition, a new data quality-control tool was developed for the Dobson automation software (WinDobson). This paper presents a comparison of Dobson Umkehr ozone profiles from NOAA ozone network stations – Boulder, the Haute-Provence Observatory (OHP), the Mauna Loa Observatory (MLO), Lauder – against several satellite records, including Aura Microwave Limb Sounder (MLS; ver. 4.2), and combined solar backscatter ultraviolet (SBUV) and Ozone Mapping and Profiler Suite (OMPS) records (NASA aggregated and NOAA cohesive datasets). A subset of satellite data is selected to match Dobson Umkehr observations at each station spatially (distance less than 200 km) and temporally (within 24 h). Umkehr Averaging kernels (AKs) are applied to vertically smooth all overpass satellite profiles prior to comparisons. The station Umkehr record consists of several instrumental records, which have different optical characterizations, and thus instrument-specific stray light contributes to the data processing errors and creates step changes in the record. This work evaluates the overall quality of Umkehr long-term measurements at NOAA ground-based stations and assesses the impact of the instrumental changes on the stability of the Umkehr ozone profile record. This paper describes a method designed to correct biases and discontinuities in the retrieved Umkehr profile that originate from the Dobson calibration process, repair, or optical realignment of the instrument. The Modern-Era Retrospective analysis for Research and Applications version 2 (MERRA-2) Global Modeling Initiative (M2GMI) and NASA Global Modeling Initiative chemistry transport model (GMI CTM) ozone profile model output matched to station location and date of observation is used to evaluate instrumental step changes in the Umkehr record. Homogenization of the Umkehr record and discussion of the apparent stray light error in retrieved ozone profiles are the focus of this paper. Homogenization of ground-based records is of great importance for studies of long-term ozone trends and climate change.
Sources and advection of atmospheric particulate matter on the Island of Hawaii were assessed to properly evaluate the benchmark qualities of the air at the Mauna Loa Geophysical Observatory. A manually operated Gardner counter, a continually recording Aitken counter and a nephelometer were used to measure diurnal and long term trends of concentrations and light scattering coefficients of atmospheric particulate. Significant sources of aerosol particles result from combustion activities on the island, both man-made and volcanic. Volcanic effluent can penetrate the tradewind inversion when conditions are right and show up on long term Aitken counts at the Mauna Loa Observatory. The relative contribution of marine aerosols to the total particle population in the air masses over the island is small. The difference in concentration and the light scattering coefficient of particles in the air masses above and below the tradewind inversion are in the order of one magnitude or more.
The unique boundary layer at Mauna Loa Observatory (3396 meters) is examined with a combination of radiosondes launched from the observatory and a novel aerosol profiling technique called CLidar or camera lidar. This boundary layer is influenced by a combination of radiation winds, due to the heating and cooling of the surrounding lava, and off-island winds. Typically an upslope surface wind forms after sunrise as the ground heats up. The reverse occurs after sunset as the ground cools and a temperature inversion, tens of meters thick forms. Aerosol increases for the first 90 to 160 meters and then decreases to free tropospheric levels. The 90 to 160 m aerosol peak indicates the vicinity of the upslope/downslope interface in the air flow. An upper transition is seen in the aerosol gradient at about 600 meters above the observatory (4000 m Above Sea Level). This transition is also seen in radiosonde potential temperature data. The sondes indicate that the air above the nighttime downslope surface region usually has an upslope component. Some of this counter-flowing air can be entrained in the downslope air, possibly influencing the sampling of aerosols and trace gases at the observatory.
Aerosol and precipitation samples collected 3.4 km above sea level on the island of Hawaii have only 1% of the concentrations of Na that samples collected at sea level have. This difference suggests a short residence time for marine aerosols moving up the slopes of Mauna Loa. The major increase in the bulk chemistry of K, Ca, and Mg relative to Na occurs during the rapid loss of the first 90% of the aerosol mass. The chemistry of the remaining 'fractionated' aerosols resembles that of Hawaiian rain. A second population of aerosols, with substantially lower Na concentrations than fractionated marine aerosols, is present above the trade wind inversion. The major cation chemistry of these aerosols resembles that of continental rain.
The U.S. Department of Agriculture UV-B Monitoring Program measures ultraviolet light at seven wavelengths from 300 to 368 nm with an ultraviolet multifilter rotating shadow-band radiometer (UV-MFRSR) at 25 sites across the United States, including Mauna Loa, Hawaii. Column ozone has been retrieved under all-sky conditions near Boulder, Colorado (40.177 �N, 105.276 �W), from global irradiances of the UV-MFRSR 332- and 305-nm channels (2 nm FWHM) using lookup tables generated from a multiple-scattering radiative transfer code suitable for solar zenith angles (SZA�s) up to 90�. The most significant sources of error for UV-MFRSR column ozone retrievals at SZA�s less than 75� are the spectral characterizations of the filters and the absolute calibration uncertainty, which together yield an estimated uncertainty in ozone retrievals of ?4.0%. Using model sensitivity studies, we determined that the retrieved column ozone is relatively insensitive (
Seasonal spatial and temporal gradients for the CO2 mole fraction over North America are examined by creating a climatology from data collected 2004–2013 by the NOAA/ESRL Global Greenhouse Gas Reference Network Aircraft Program relative to trends observed for CO2 at the Mauna Loa Observatory. The data analyzed are from measurements of air samples collected in specially fabricated flask packages at frequencies of days to months at 22 sites over continental North America and shipped back to Boulder, Colorado, for analysis. These measurements are calibrated relative to the CO2 World Meteorological Organization mole fraction scale. The climatologies of CO2 are compared to climatologies of CO, CH4, SF6, N2O (which are also measured from this sampling program), and winds to understand the dominant transport and chemical and biological processes driving changes in the spatial and temporal mole fractions of CO2 as air passes over continental North America. The measurements show that air masses coming off the Pacific on the west coast of North America are relatively homogeneous with altitude. As air masses flow eastward, the lower section from the surface to 4000 m above sea level (masl) becomes distinctly different from the 4000–8000 masl section of the column. This is due in part to the extent of the planetary boundary layer, which is directly impacted by continental sources and sinks, and to the vertical gradient in west-to-east wind speeds. The slowdown and southerly shift in winds at most sites during summer months amplify the summertime drawdown relative to what might be expected from local fluxes. This influence counteracts the dilution of summer time CO2 drawdown (known as the “rectifier effect”) as well as changes the surface influence “footprint” for each site. An early start to the summertime drawdown, a pronounced seasonal cycle in the column mean (500 to 8000 masl), and small vertical gradients in CO2, CO, CH4, SF6, and N2O at high-latitude western sites such as Poker Flat, Alaska, suggest recent influence of transport from southern latitudes and not local processes. This transport pathway provides a significant contribution to the large seasonal cycle observed in the high latitudes at all altitudes sampled. A sampling analysis of the NOAA/ESRL CarbonTracker model suggests that the average sampling resolution of 22 days is sufficient to get a robust estimate of mean seasonal cycle of CO2 during this 10 year period but insufficient to detect interannual variability in emissions over North America.
The Keeling Curve, the iconic record of atmospheric carbon dioxide (CO2) measured at the Mauna Loa Observatory (Figure 1) reveals a stunning fact. It shows the annual cycle, caused by net uptake of CO2 by terrestrial ecosystems in the northern hemisphere during the growing season, and approximately the same amount of carbon released back to the atmosphere through respiration of plants and soils during the rest of the year.
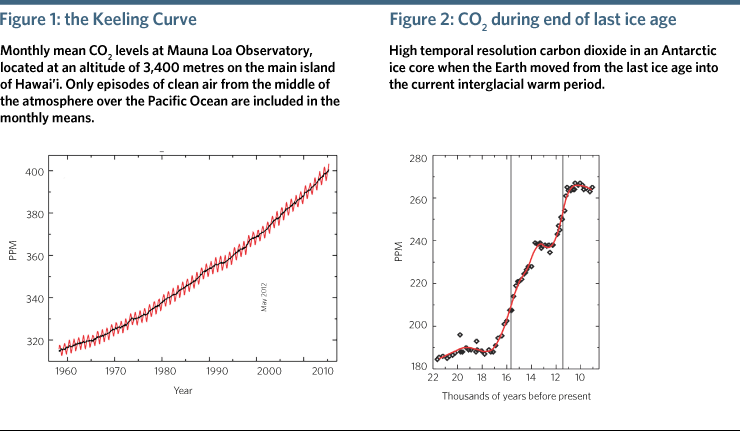
The peak-to-trough amplitude was about six parts per million (ppm) in the early part of the record and is now typically about seven ppm. It takes the removal of approximately seven billion tonnes of carbon (the same as 25.7 billion tonnes of CO2) to lower CO2 in the entire hemisphere by seven ppm. Currently all global emissions from the burning of coal, oil and natural gas, and from cement production, amount to 10 billion tonnes per year, more than the net seasonal uptake by all crops, forests, grasslands and tundra combined.
It should therefore be no surprise that the most striking feature of the Keeling Curve is the overall increase, accelerating from about 0.7 ppm per year in the early years to slightly over two ppm per year today. Half of all fossil-fuel emissions since pre-industrial times have taken place since 1988. There were large ups and downs of CO2 during ice ages and warm interglacial periods over the last 800,000 years.
The first 12 years (1974-1985) of continuous atmospheric CO2 measurements from the NOAA GMCC program at the Mauna Loa Observatory in Hawaii are analyzed. Hourly and daily variations in the concentration of CO2 due to local sources and sinks are described, with subsequent selection of data representing background concentrations. A digital filtering technique using the fast Fourier transform and low-pass filters was used to smooth the selected data and to separate the seasonal cycle from the long-term increase in CO2.The amplitude of the seasonal cycle was found to be increasing at a rate of 0.05 ± 0.02 ppm yr-1. The average growth rate of CO2 was 1.42 ± 0.02 ppm yr-1, and the fraction of CO2 remaining in the atmosphere from fossil fuel combustion was 59%. A comparison between the Mauna Loa continuous CO2 data and the CO2 flask sample data from the sea level site at Cape Kumukahi, Hawaii, showed that the amplitude of the seasonal cycle at Cape Kumukahi was 23% larger than at Mauna Loa, with the phase of the cycle at Mauna Loa lagging the cycle at Cape Kumukahi by about 1-2 weeks.
Fungi are ubiquitous and often abundant components of virtually all ecosystems on Earth, serving a diversity of functions. While there is clear evidence that fungal-mediated processes can influence environmental conditions, and in turn select for specific fungi, it is less clear how fungi respond to environmental fluxes over relatively long time frames. Here we set out to examine changes in airborne fungi collected over the course of 13 y, which is the longest sampling time to date. Air filter samples were collected from the Mauna Loa Observatory (MLO) on Hawaii Island, and analyzed using Illumina amplicon sequencing. As a study site, MLO is unique because of its geographic isolation and high elevation, making it an ideal place to capture global trends in climate and aerobiota. We found that the fungal aerobiota sampled at MLO had high species turnover, but compositional similarity did not decrease as a function of time between samples. We attribute these patterns to neutral processes such as idiosyncratic dispersal timing and trajectories. Furthermore, the composition of fungi at any given point was not significantly influenced by any local or global environmental variables we examined. This, and our additional finding of a core set of persistent fungi during our entire sampling period, indicates some degree of stability among fungi in the face of natural environmental fluctuations and human-associated global change. We conclude that the movement of fungi through the atmosphere is a relatively stochastic process.
Earth system models project that the tropical land carbon sink will decrease in size in response to an increase in warming and drought during this century, probably causing a positive climate feedback. But available data are too limited at present to test the predicted changes in the tropical carbon balance in response to climate change. Long-term atmospheric carbon dioxide data provide a global record that integrates the interannual variability of the global carbon balance. Multiple lines of evidence demonstrate that most of this variability originates in the terrestrial biosphere. In particular, the year-to-year variations in the atmospheric carbon dioxide growth rate (CGR) are thought to be the result of fluctuations in the carbon fluxes of tropical land areas. Recently, the response of CGR to tropical climate interannual variability was used to put a constraint on the sensitivity of tropical land carbon to climate change. Here we use the long-term CGR record from Mauna Loa and the South Pole to show that the sensitivity of CGR to tropical temperature interannual variability has increased by a factor of 1.9 ± 0.3 in the past five decades. We find that this sensitivity was greater when tropical land regions experienced drier conditions. This suggests that the sensitivity of CGR to interannual temperature variations is regulated by moisture conditions, even though the direct correlation between CGR and tropical precipitation is weak. We also find that present terrestrial carbon cycle models do not capture the observed enhancement in CGR sensitivity in the past five decades. More realistic model predictions of future carbon cycle and climate feedbacks require a better understanding of the processes driving the response of tropical ecosystems to drought and warming.
Trans-Pacific transport of enhanced ozone plumes has been mainly attributed to fossil fuel combustion in Asia in spring, but less attention has been paid to vegetation fires in Asia. Here we show that the El Niño-Southern Oscillation (ENSO)-modulated fires in Southeast Asia, rather than Asian fossil fuel plumes, dominate the interannual variability of springtime trans-Pacific transport of ozone across the entire North Pacific Ocean. During El Niño springs, the intensified fires from both the Indochinese Peninsula and Indonesia, together with large-scale circulation anomalies, result in enhanced ozone plumes that stretch over 15 000 km in both the lower-middle and upper troposphere. This enhancement is also observed in the in situ measurements of ozone concentration, with an almost 10% increase at Mauna Loa Observatory, Hawaii, a unique site to monitor the long-distance transport over the North Pacific. This study reports an unexpectedly strong influence of vegetation fires, linked with climate variability, on global tropospheric chemistry and proves once more how complex the interactions in the climate system are.
An air sampling campaign on the Island of Hawaii aimed to assess background concentrations of semivolatile organic compounds (SVOCs) over the Central Northern Pacific and to explore their distribution along an altitudinal transect. XAD-resin-based passive air samplers were deployed from May to September 2011 at six sites along a transect from the northeastern coast to the Mauna Loa Observatory and at three other island sites. By crossing the trade wind inversion, the transect comprised the marine boundary layer and free troposphere. At the two ends of the transect, flow-through samplers simultaneously sampled air at monthly resolution. Elevated levels of dieldrin, chlordane- and DDT-related pesticides, polycyclic aromatic hydrocarbons (PAHs), and polybrominated diphenyl ethers (PBDEs) at two urban sites indicated contributions from local sources. The composition of chlordane and DDT-related residues indicated recent emissions. PAHs concentrations that decline more rapidly with increasing elevation than those for PBDEs are consistent with faster atmospheric degradation of PAHs. SVOC levels on Mauna Loa were generally at the lower end of concentration ranges reported for remote sites, including the Arctic. However, in contrast to the Arctic, long-range atmospheric transport is deemed less important than human-induced material flow as the source of SVOCs to the island’s atmosphere.