
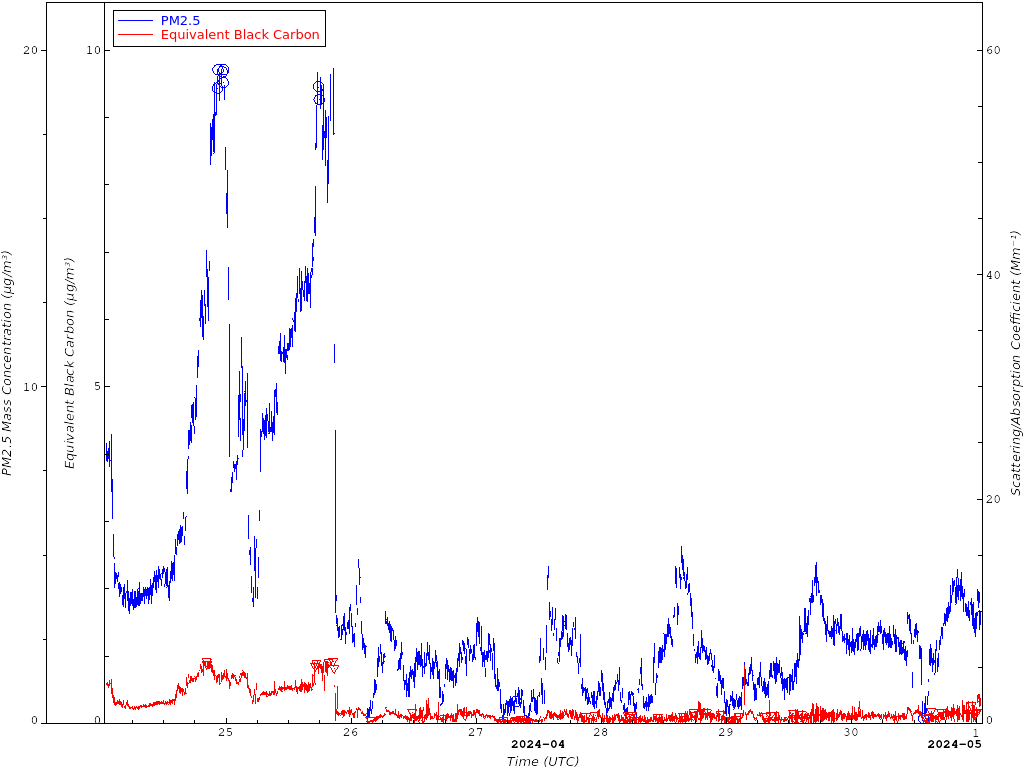
The time axis is Coordinated Universal Time (UTC). Local time in Boulder (MDT) is UTC-6 hours.
Typical summertime mass concentration (blue line) in Boulder is ~4 μg/m3 (Based on summertime scattering values of approximately 12 Mm-1).
Equivalent black carbon (red line) is derived from aerosol light absorption coefficient. Black carbon is a product of incomplete combustion (e.g., diesel engines, fires).
The plot shows the haze concentration measured at Table Mountain observatory a few miles north of Boulder. The PM2.5 mass concentration is estimated from optical measurements of particle light scattering coefficient using a mass scattering efficiency of 3 m2/g. The EBC concentration is estimated from filter-based measurements of particle light absorption coefficient using a mass absorption efficiency of 6 m2/g.
To put this plot in context, the US EPA classifies air quality based on 24h averages of PM2.5 concentrations on the following scale:
≤ 12 μg/m3 = good
12-35.4 < μg/m3 = moderate
35.5-55.4 μg/m3 = unhealthy for sensitive groups
55.5-150.4 μg/m3 = unhealthy
150.5-250.4 μg/m3 = very unhealthy
≥ 250.5 μg/m3 = hazardous
You can see the corresponding air quality index (AQI) values at AirNow. Note that the PM2.5 values shown on the plot above are just estimates and are not an official measurement.
Click on any of the links below to see plots of specific events measured in Boulder.
Four Mile Canyon fire, September 2010
Flagstaff fire, June 2012
Fontanelle fire (Wyoming), June 2012
Cameron Peak, Calwood and other fires, August-October, 2020
Models can help identify sources of haze when the source is not obvious.
Below are some links to aerosol model output for TODAY
-
Naval Research Lab NAAPS aerosol model output
(Today's smoke, sulfate and dust contribution to the US atmosphere).
More information about the Naval Research Lab NAAPS aerosol model. . -
NOAA/ESRL/GSL Rapid Refresh (RAP)
model output for WRF-CHEM . (click on any of the variety of menu options to see forecast of simulated smoke.)
More information about the NOAA/ESRL/GSL model .
More information about smoke and air quality can be found at the EPA Particulate Matter web page.
Additional local webcam images can be found at Boulder Flatiron Cams
NOAA's Global Monitoring Laboratory measures the climate-forcing properties of atmospheric particles at a
global network of monitoring stations.
Instruments from this network are maintained by NOAA's Global Monitoring Laboratory in Boulder, CO.
Plots of the raw number concentration, aerosol light scattering and absorption measurements at Table Mountain are available from GML's Aerosol program. Please refer questions about the aerosol measurements to Dr. Patrick Sheridan, patrick.sheridan@noaa.gov.
Surface ozone measurements are also made at Table Mountain by GML's Ozone and Water Vapor group. Please refer questions about the ozone
measurements to Dr. Irina Petropavlovskikh, irina.petro@noaa.gov.