|
Information
Results
Get Involved
Resources
|
|
|
|
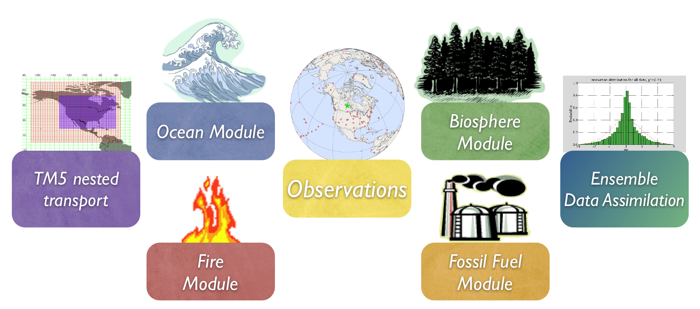
To learn more about a CarbonTracker component, click on one of the above images.
Or download the full PDF version for convenience.
|
|
1. Introduction
Human beings first influenced the carbon cycle through land-use change. Early humans used fire to control animals and later cleared forest for agriculture. Over the last two centuries, following the industrial and technical revolutions and the world population increase, fossil fuel combustion has become the largest anthropogenic source of CO2. Coal, oil and natural gas combustion indeed are the most common energy sources in both developed and developing countries. Various sectors of the economy rely on fossil fuel combustion: power generation, transportation, residential/commercial building heating, and industrial processes. In 2006, the world emissions of CO2 from fossil fuel burning, cement manufacturing, and flaring reached 8.2 PgC (one PgC=1015 grams of carbon) [CDIAC] and we estimate the global total for 2008 to be 8.7 PgC. This represents a 41% increase over 1990. The North American (U.S.A, Canada, and Mexico) flux of CO2 to the atmosphere from fossil fuel burning was 1.8 PgC in 2006, representing 22% of the global total. The International Energy Outlook has projected that the global total source will reach 9.0 PgC in 2015 and 11.0 PgC in 2030 [DOE]. Despite the recent economic slowdown, fossil fuel emissions continue to increase, and we are still on track to exceed the 2015 before that time.
2. Detailed Description
- Totals
The fossil fuel emission inventory used in CarbonTracker is derived from independent global total and spatially-resolved inventories. Annual global total fossil fuel CO2 emissions are from the Carbon Dioxide Information and Analysis Center (CDIAC) [Boden et al. 2009] which extend through 2006. In order to extrapolate these fluxes to 2007 and 2008, we derive relative increases for each fuel type (solid, liquid and gas) in each country from the BP Statistical Review of World Energy for 2007 and 2008.
- Spatial Distribution
Fluxes are then spatially distributed in two steps: First, the coarse scale flux distribution country totals from Boden et al. [2009] are mapped onto a 1x1 degree grid; Next, we distribute the country totals within the countries according to the spatial patterns from the EDGAR-4 inventories [EDGAR, Olivier and Berdowski, 2001; edgar.jrc.ec.europa.eu], which are annual estimates also at 1x1 degree resolution. The CDIAC country-by-country totals, however, do not sum to the CDIAC global total. We hold the global totals to be more accurate and ascribe the difference (about 5% of the global total) to marine bunker fuels. Emissions from these bunker fuels are placed entirely in the ocean basins along shipping routes according to patterns from the EDGAR database.
- Temporal Distribution
In order to avoid discontinuities in the fossil fuel emission first derivative between consecutive years, an annually conserving spline is fit to the aseasonal emissions in each 1x1 degree pixel [Rasmussen, 1991]. A normalized seasonal cycle derived by extracting the first and second harmonics [Thoning et al, 1989] from the Blasing et al. [2005] analysis for the United States (which has ~10% higher emissions in winter than in summer) is imposed on the North American emissions between 30 and 60 degrees north; for Eurasia, a preliminary set of seasonal emission factors from EDGAR (by emission sector) is used to define Eurasian seasonality, also only from 30-60 N. The Eurasian seasonal amplitude is about 25%, significantly larger than that in North America, owing to the absence of a secondary summertime maximum due to air conditioning.
- Uncertainties
Overall the Eurasian seasonality is uncertain, but most likely a better representation than assuming no emission seasonality at all. The uncertainty attached to the global total source is of order 10%, but the uncertainty for individual regions of the world could be much larger. This source is not optimized in the current CarbonTracker system as we do not believe our current network can constrain this source separately from the others. In the future we hope that the addition of anthropogenic tracers to the CarbonTracker system, including 14CO2, will allow us to observationally constrain fossil fuel emissions. A near term step may be to more formally represent uncertainty in fossil fuel emissions by allowing for emission variation across ensemble members. Although the contribution of CO2 from fossil fuel burning to the observed CO2 mole fraction is considered known, extra model error is included in the system to represent the random errors in fossil fuels.
3. Further Reading
|
|
