
Currently, there is worldwide concern over climate change. You have probably heard about the changing climate from multiple sources: scientists and politicians in the news, family members, teachers, and friends. Why are many people so concerned about climate change, and what scientific evidence suggests that it is occurring? What causes can be attributed to this change?
As you may know, much of the concern for our climate is due to science which studies the Earth's atmosphere. This activity will introduce you to the basic scientific understanding of how Earth's atmosphere affects climate. You will analyze real scientific measurements of carbon dioxide (CO2), one of the most important greenhouse gases (GHGs) which influence climate. By investigating the recent trends in CO2, you will be playing the role of a scientist trying to interpret the condition of Earth's atmosphere. You will then use your understanding of how the atmosphere works, in light of these trends, to determine whether or not humans should be concerned over the climate.
Before you can interpret scientific data on the atmosphere, you must first understand some fundamental concepts of how the Earth and the atmosphere interact. Carefully read the Basics of the Carbon Cycle and the Greenhouse Effect. If there are any unfamiliar terms throughout this activity, refer to the Glossary of Terms. If you require additional assistance, see the Frequently Asked Questions.
This activity will require you to use several web tools to analyze CO2 concentrations from sites around the globe, measured by NOAA. By analyzing short and long-term trends of CO2 in the atmosphere, you will learn how the atmosphere and climate are changing and determine the causes that are responsible for these changes.
The Interactive Atmospheric Data Visualization (IADV) website is a data exploration tool for the trace gases measured by NOAA. The following tasks will guide you through the process of utilizing this tool.
Task 1: Go to the IADV page on the NOAA website, located at: http://gml.noaa.gov/dv/iadv/
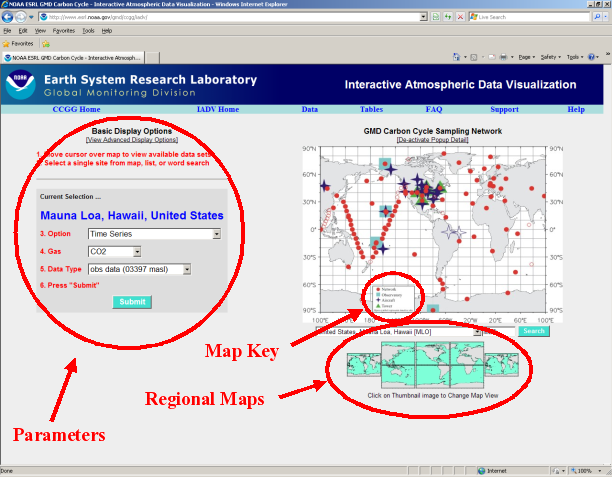
The IADV is comprised of actual scientific data from all of the measurement sites within the Cooperative Air Sampling Network at NOAA. Begin this activity by familiarizing yourself with the different measurement sites and IADV maps. Notice that the default measurement site is Mauna Loa, Hawaii. Atmospheric trace gas measurements were first introduced at this site, so it has the longest ongoing record of CO2. You can click on the thumbnail images below the world map in order to view enlarged maps of various world regions. Hold the pointer over each site to view its name, location, and sampling details; click on a site to select it for data visualization.
Within the map there are four different symbols with four corresponding measurement program types. Study the map key to determine the four different types of measurement programs. Which site in the network is closest to your current location, and which type of measurement program is located there?
Task 2: Using Mauna Loa, Hawaii, United States [MLO] for data visualization, explore several options offered by the IADV and answer the following questions:
A. What are the latitude and longitude of the MLO site? Based on your prior knowledge, how would you describe the location and geographic characteristics of this site (is it remote or close to large human populations, which hemisphere [northern/southern] is this site located within, is it near ocean or land, what is the elevation above sea level, etc.)? Hint: masl=meters above sea level, a measurement of elevation.
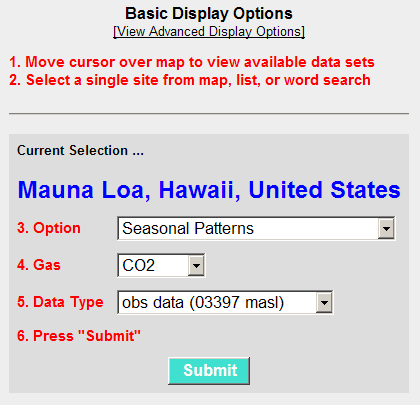
B. Obtain a graph of the trends of atmospheric CO2 at the MLO site. Here is a snapshot of the parameters required for this graph.
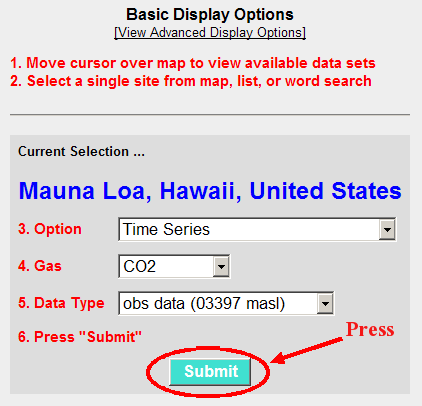
These are the default parameters for the IADV. After pressing submit, you can look at the graph on the website, or select the "Click here for PDF version" link located at the upper-right corner of the graph page to download the graph to your computer. Note that CO2 concentrations are reported in μmol mol-1, which are equivalent to ppm. You may answer using either unit, but be sure to include units in your answers.
Describe the short (annual) and long-term (over the entire measurement period) trends visible within this graph. Make specific reference to the current concentration of CO2, the overall net change of CO2 over the measurement period, and the approximate annual rate of change (the slope--annual rate of change=overall net change divided by the number of years of measurement).
C. What do you think might be causing the long-term trends in CO2 at MLO (refer to the Basics of the Carbon Cycle and Greenhouse Effect Page to answer this question)?
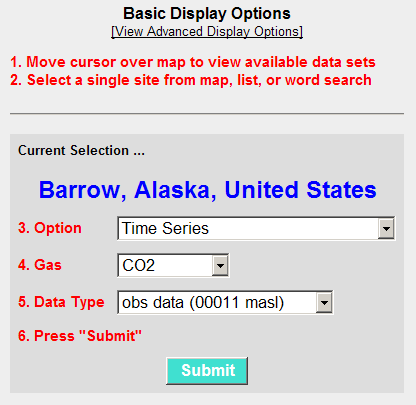
Task 3: Using Barrow, Alaska, United States [BRW] for data visualization, explore several options offered by the IADV and answer the following questions:
A. What are the latitude and longitude of the BRW site? How would you describe the location and geographic characteristics of this site?
B. Obtain a graph of the trends of atmospheric CO2 at the BRW site. Here is a snapshot of the parameters required for this graph.
Describe the short- and long-term trends visible within this graph.
C. Compare the BRW trends to the MLO trends in terms of similarities and differences. What might cause these similarities and differences?
Task 4: Using the South Pole, Antarctica, United States [SPO] for data visualization, explore several options offered by the IADV and answer the following questions:
A. What are the latitude and longitude of the SPO site? How would you describe the location and geographic characteristics of this site?
B. Obtain a graph of the trends of atmospheric CO2 at the SPO site. Here is a snapshot of the parameters required for this graph.

Describe the short- and long-term trends visible within this graph.
C. Compare the SPO trends to the trends at MLO and BRW in terms of similarities and differences. What might cause these similarities and differences?
Task 5: Using the IADV website, you will now analyze and compare the seasonal variations of each of the baseline observatory sites. These seasonal variations are responsible for the short-term trends that you have observed in the previous tasks.
A. Obtain an Average Seasonal Cycle graph of CO2 at the MLO site. Here is a snapshot of the required parameters. Disregard the bottom, Seasonal Cycle Difference graph on the graph page.
Which month of each year has the local maximum value of CO2 (on average)?
Which month of each year has the local minimum value of CO2 (on average)?
What is the difference in CO2 concentrations between these average seasonal maximum and minimum? Note: this graph has been scaled so that zero is set as the average annual CO2 concentration.
B. Obtain an Average Seasonal Cycle graph of CO2 at the BRW site. Here is a snapshot of the required parameters.

Which month of each year has the local maximum value of CO2?
Which month of each year has the local minimum value of CO2?
What is the difference in CO2 concentrations between these average seasonal maximum and minimum?
C. Obtain an Average Seasonal Cycle graph of CO2 at the SPO site. Here is a snapshot of the required parameters.

Which month of each year has the local maximum value of CO2?
Which month of each year has the local minimum value of CO2?
What is the difference in CO2 concentrations between these average seasonal maximum and minimum?
D. Here is a graph that can be obtained using the IADV which provides a comparison between the different baseline observatories that you have studied. Answer the following questions using the provided graph:
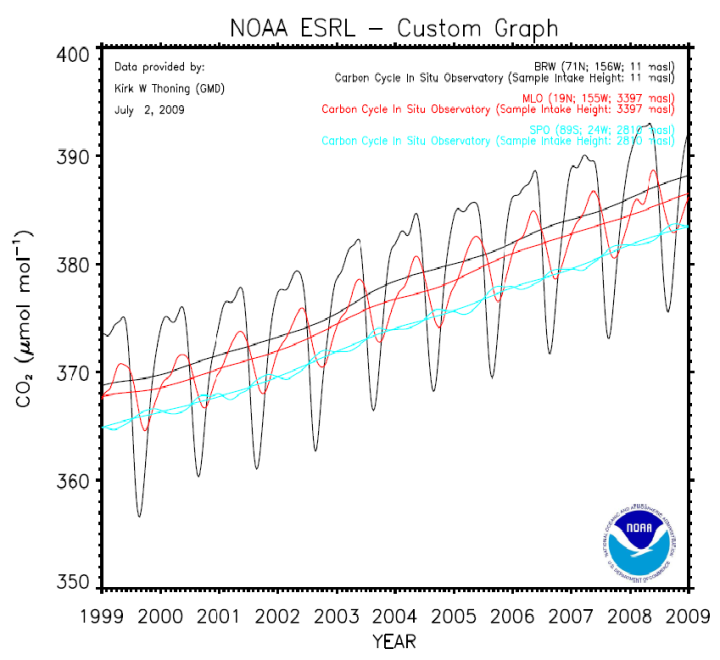
Notice the short-term oscillations/cycles of each data set. Notice that the period of each oscillation is approximately one year. What does each oscillation represent?
Do the annual maxima and minima align for each data set? If not, why do you think that they are different?
How do the amplitudes (differences between local maximum and minimum) of each data set compare? Which site exhibits the greatest annual variability? Which site exhibits the least annual variability? Can you explain the difference?
Notice the trend lines that provide an annual average for each of the sampling sites. Are the average annual values the same at each site? If not, explain why.
GLOBALVIEW is a tool used for climate modeling which can aid in the visualization of the distribution of atmospheric gases across space and time. This activity will help you to visualize some of the short and long-term trends in CO2 measurements.
Task 6: Go to the GLOBALVIEW-CO2 page in order to answer the following questions:
(http://www.esrl.noaa.gov/ccgg/globalview/co2/co2_intro.html)
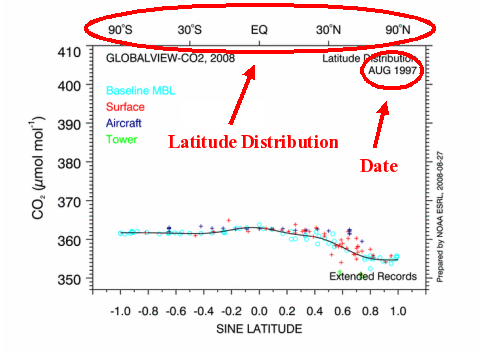
This moving graph summarizes the large number of CO2 measurements into a single picture.
A. Can you identify a long-term trend in the data provided by GLOBALVIEW?
How does this agree with your findings in Tasks 2-4?
Which reservoir and sources of carbon do scientists identify as the cause of this long-term trend?
B. Notice the latitude distribution from left to right on the graph--ranging from southern latitudes to northern latitudes. Which hemisphere, northern or southern, exhibits a greater degree of seasonal variability?
How does this agree with your findings in Task 5?
What reservoir(s) and sources of carbon do scientists identify as the cause of this short-term variability?
C. It takes about one year for the atmosphere to mix between the northern and southern hemispheres-can you pinpoint the hemisphere where most of the CO2 originates? Does one hemisphere appear to "lag" behind the other in terms of increasing CO2 concentrations?
Summary and Application
As observed throughout this activity, there is a long-term increase in atmospheric CO2 concentrations overlying consistent seasonal variation. This CO2 increase coincides with increases in most of the other GHG concentrations as well (which can also be visualized with the IADV). The data which you have observed is a powerful scientific indicator that the atmosphere is changing over time, and it is some of the primary evidence that concerns those studying the climate. Scientists are most concerned with the long-term increase in CO2 levels which is be attributed to human causes, but they also use the short-term seasonal fluctuations to understand how CO2 is exchanged naturally on an annual scale. Now that you have a scientific understanding of carbon cycle science, answer the following application questions.
What implications do the observed long-term trends of CO2 have for the Earth and its climate system? Make specific reference to the Greenhouse Effect.
Given the increasing levels of CO2 within Earth's atmosphere and the role that it has in warming the atmosphere, do you think that humans have reason for concern? Justify your answer with the concepts and data that you have studied throughout this activity.
Many scientists are now referring to CO2 emissions as "pollution" due to the implications on Earth's atmosphere. How can this be justified as a pollutant when it is a gas that is naturally part of our atmosphere (in fact, even humans breathe it out during respiration)?
Identify, being as specific as possible, some of the sources and sinks of CO2 in your region. At what times of the year are each of these sources and sinks most influential on the atmosphere?
Which of your own daily activities contribute most to increasing atmospheric CO2 levels and changing the climate? What are some steps that you could take to decrease this effect?
Optional Research Question:
Identify the potential implications of the observed data on natural ecosystems and human society on a global, regional, and individual scale. When considering human society, you might include impacts on human needs, economy, energy, industry, agriculture, policy, etc. Be sure to identify some of the current and predicted impacts of a changing climate on your region. What steps can be taken to remediate this environmental issue? You will need to refer to outside sources in order to answer this question (see some of the provided links).