Mass Flux Through the Tropics

Download a postscript version of this plot: massflux.ps
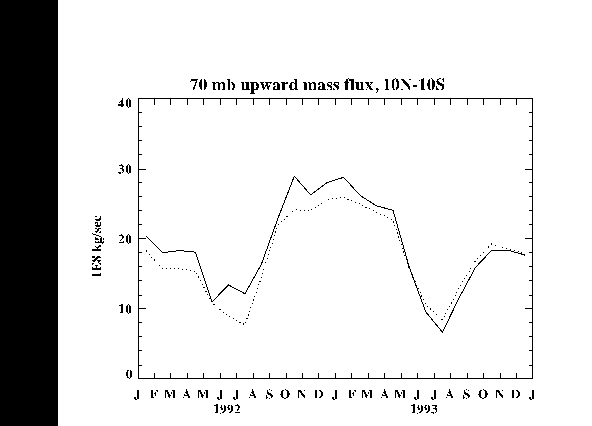
This figure shows the seasonal pattern for mass flux of upward moving air (in units of 1 x 10⁸ kg/sec) through the tropics as defined by latitudes from 10o N to 10o S. The 2 lines are the calculation done using either UARS UKMO temperatures (solid line) or the NMC stratospheric analysis temperatures (dotted line). For more information, please see Rosenlof [1995] or contact Dr. Karen Rosenlof.
Reference:
Rosenlof, K. H., Seasonal cycle of the residual mean meridional circulation, Journal of Geophysical Research, 100, 5173-5191, 1995.