Tropical Pipe
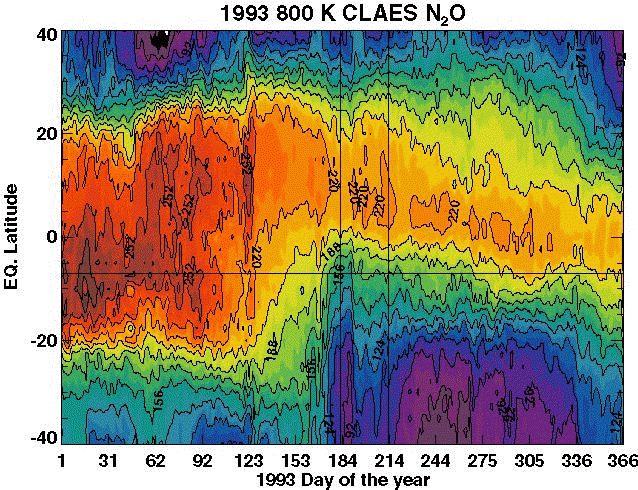
The boundaries of the tropical pipe are shown clearly in this N2O contour plot of mixing ratios (in ppbv) at 800 K. Color shades towards red of the spectrum are tropical air and shades towards the violet end of the spectrum represent midlatitude air. Data are from the CLAES instrument on the UARS satellite (plot courtesy of Dr. Paul Newman of NASA/Goddard).
Ratios of NOy:O3 between 50 and 70 mb have been used
to defined the latitudinal boundaries of tropical air from the ER-2 airborne
missions [Murphy et al., 1993; Fahey et al., 1996]. Values near
1 x 10⁻³ indicate the presence of tropical air in the stratosphere,
whereas values near 3 x 10⁻³ defined midlatitude. Using ER-2 tracer
data (including N2O, CFC-11, O3, and others), Volk et al. [1996]used
this criteria to quantify the mixing fraction of midlatitude air into the tropics.
Data are presented here with permission from Dr.
David W. Fahey (NOy) and Dr.
James J. Margitan (O3).
References:
Fahey, D. W., S. G. Donnelly, E. R. Keim, R. S. Gao, R. C. Wamsley, L. A.
Del Negro, E. L. Woodbridge, M. H. Proffitt, K. H. Rosenlof, M. K. W. Ko, D.
K. Weisenstein, C. J. Scott, C. Nevison, S. Solomon, K. R. Chan, In situ
observations of NOy, O3, and the NOy/O3 ratio in the lower
stratosphere, Geophysical Research Letters,23, 1653-1656, 1996.
Murphy, D. M., D. W. Fahey, M. H. Proffitt, S. C. Liu, K. R. Chan, C. S. Eubank,
S. R. Kawa, K. K. Kelly, Reactive nitrogen and its correlation with ozone in
the lower stratosphere and upper troposphere, Journal of Geophysical Research,
98, 8751-8773, 1993.
Volk, C. M., J. W. Elkins, D. W. Fahey, R. J. Salawitch, G. S. Dutton, J. M.
Gilligan, M. H. Proffitt, M. Loewenstein, J. R. Podolske, K. Minschwaner, J.
J. Margitan
and K. R. Chan, Quantifying transport between the tropical and mid-latitude
lower stratosphere, Science, 272, 1763-1768, 1996.
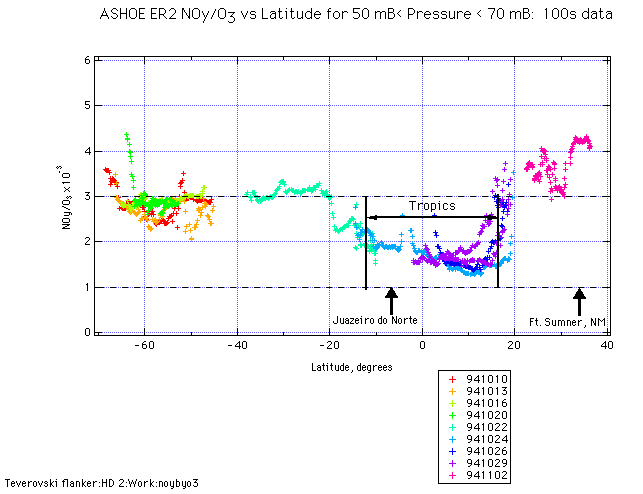
Figure1 NOy:O3 ratios during October-November
1994 of the ASHOE/MAESA mission. A value of 2 x 10⁻³ is used as the
upper limit for the tropical air mass. The boundary line is placed at average
latitude from several different flights in most cases. The error of this line
is as high as +/- 3 deg latitude. The data are averaged every 100 s.
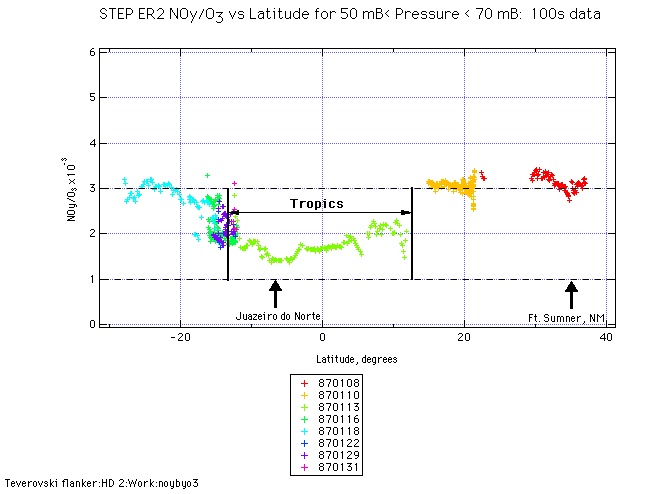
Figure2 NOy:O3 ratios during January 1987 of the STEP mission.
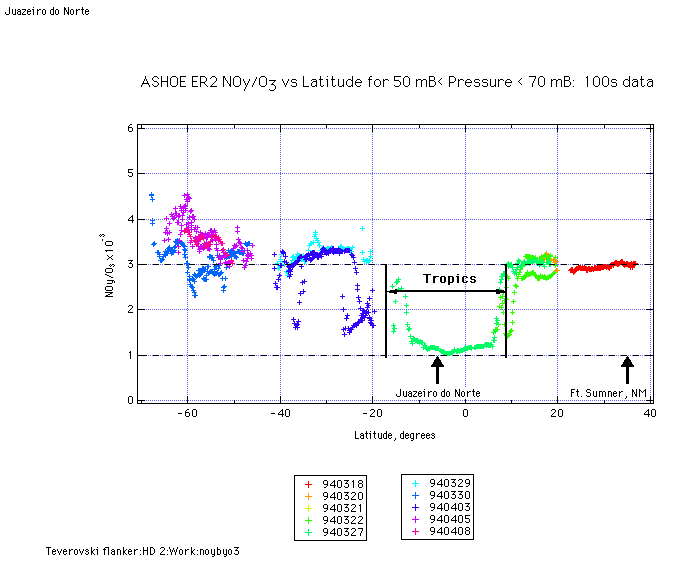
Figure3 NOy:O3 ratios during March-April 1994 of the ASHOE/MAESA mission.
![]() Back
to the LACE home page
Back
to the LACE home page