CANADIAN
METEOROLOGICAL MEMOIRS
No. 6
MEASUREMENTS OF ATMOSPHERIC OZONE
AT MOOSONEE CANADA - JULY 1 1957
TO JULY 31 1960 * : * W. D. KOMHYR
DEPARTMENT OF TRANSPORT
METEOROLOGICAL BRANCH
TORONTO ONTARIO
1960
6. ZENITH SKY OBSERVATIONS.
6.1. ADZB Observations.
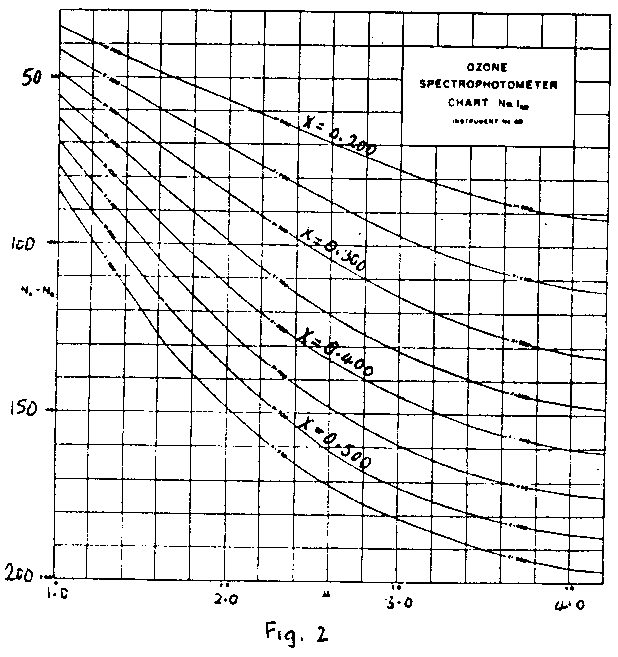
By comparing 177 nearly simultaneous XDSAD and XZBAD values measured over a wide range in μ and X since July, 1957, it was possible to correct empirically the chart supplied by Beck, Ltd., from which estimates of ozone amount are made from measurements on the blue zenith sky. The corrected chart IAD, shown in Figure 2, gave excellent results. After application of the new chart to the 177 comparison values, the following error frequencies resulted.
  Error          ≤ 1%       ≤2%       ≤3%

Frequency         54%       78%       95%
The new chart was used in the reduction of the entire body of ozone measurements made since July, 1957, on the clear zenith sky.
6.2. Use of Chart IAD on Cloudy Zenith Sky Observations.
A total of 137 ozone measurements made on the cloudy zenith sky were compared with direct sun measurements taken within 3 hours of the cloudy sky observations. The values of XZCAD, read off Chart IAD, represented a wide range of X, while μ varied from about 1.1 to 2.4. It as immediately apparent that the XZCAD values were large when compared with the direct sun total ozone amounts, especially when μ and X were high. On the basis of the data in hand, a tentative cloud correction table (Table 14) was, therefore, drawn up to be used in conjunction with Chart IAD. Also, an arbitrary cloud density scale was established consisting of the numbers 1 to 10. A cloud density of 10 implies extremely thick cloud, while figure 5 refers to cloud of medium thickness. Cloud of density 3 just obscures the sun's disc. Cloud corrections are to be applied to XZCAD values deduced from Chart IAD only when the cloud density is greater than 3.
For the 136 finally corrected cloudy zenith observations that were compared with direct sun observations, the following error frequencies were found:
  Error           ≤ 1%      ≤ 2%      ≤ 3%      ≤ 4%

Frequency          32%       55%       76%       91%
The result is very gratifying in view of the fact that the comparison observations were made several hours apart in many instances and, therefore, represent, at least in part, real changes in ozone amount. It appears likely, in general, that the errors In the values of XZCAD coded in the IGY/AGI Forms 0-1 are less than about 3%.
6.3. CC' Wavelength Observations on Blue Zenith Sky.
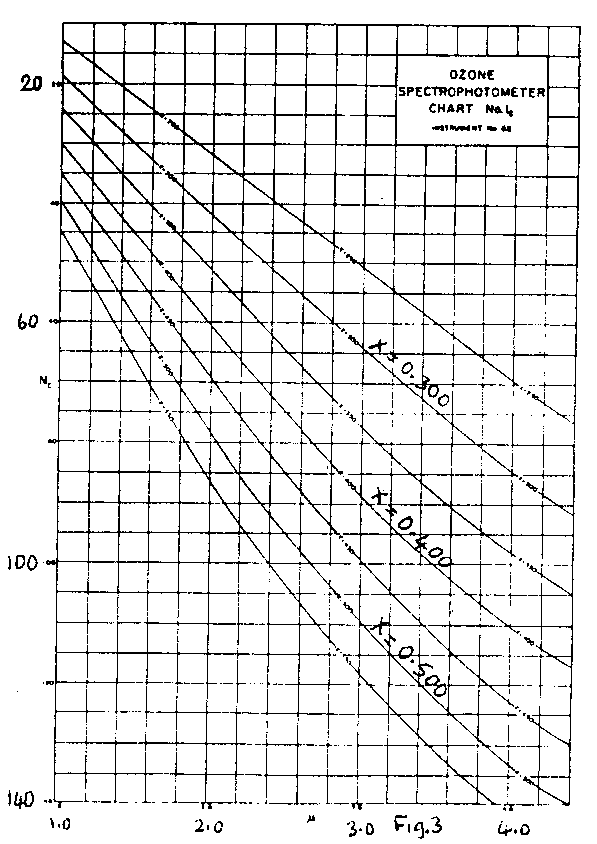
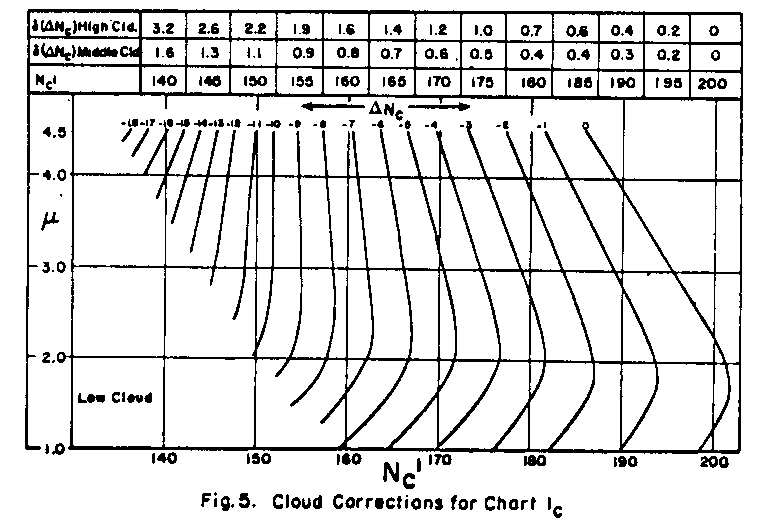
Nearly simultaneous observations on ADDS and CC'ZB were available for 201 cases. These observations were used to determine corrections to the Chart IC supplied by the manufacturer. The corrected chart, applicable to measurements at Moosonee, is shown In Figure 3. In using the new chart to evaluate CC'ZB observations, haze corrections are applied by using the cloud correction chart shown in Figure 5. In re-working the 201 cases used to construct the new chart, the following error frequencies were found:
  Error           ≤ 1%         ≤ 2%         ≤ 3%

Frequency          60%          82%          92%
6.4. CC' Wavelength Observations on Cloudy Zenith Sky.
The Oxford technique for evaluation of CC'ZC observations involves the use of two auxiliary charts to determine corrections to be applied before use of Chart IC. First, in Chart II, isopleths of constant X are plotted against coordinates NZBC' and μ. One guesses the probable value of X and reads off NZBC', applicable to exceptionally clear conditions. Next, one enters chart III with NZBC' - NZCC' and μ to get ΔNC. This correction, ΔNC, is then subtracted from NZCC. Chart IC is entered with corrected NZCC and μ to get X. If this X differs appreciably from the value assumed initially, the whole process is repeated using the new X.
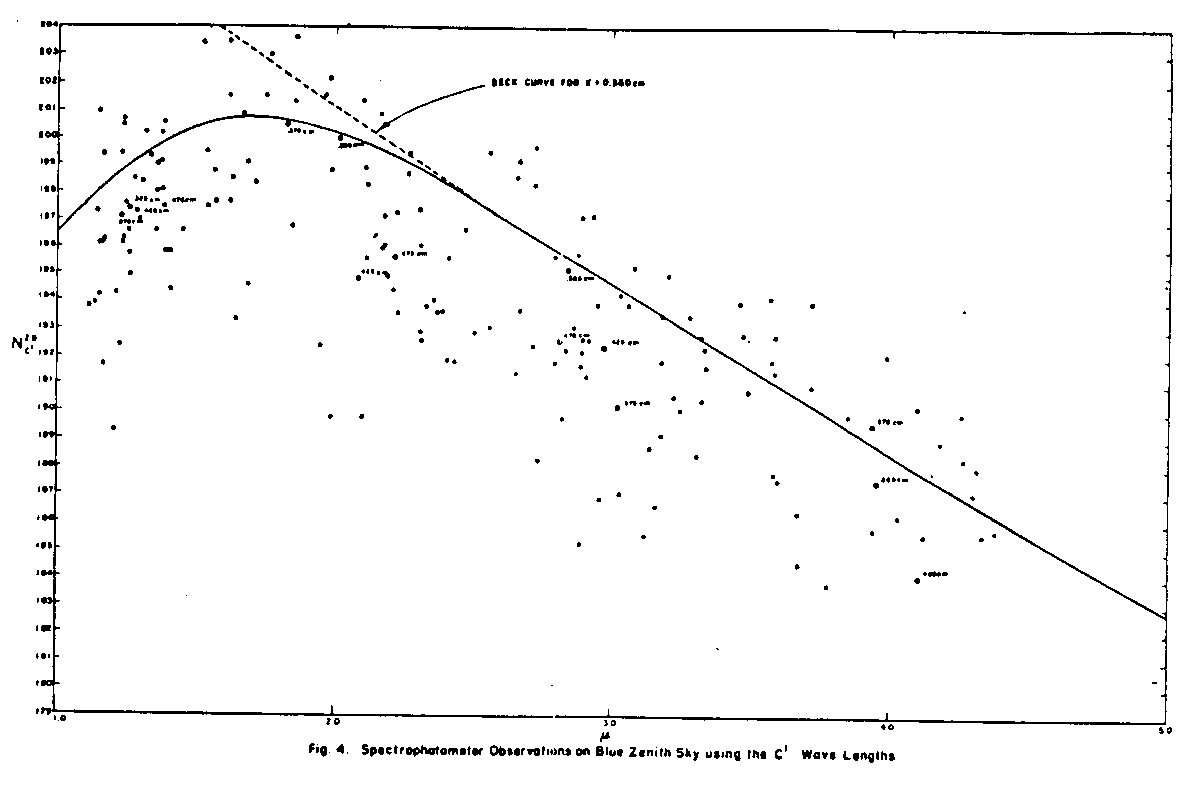
In examining the observations at Moosonee, little justification was found for constructing more than one curve on the NZBC' vs μ chart. Experimental data are plotted in Figure 4, the empty circles represent individual points and the solid circles are average points representing groups based on various X and μ ranges. The final curve, representative of all X values, is drawn just below the highest values plotted. It is interesting to note the reversal of this curve at low μ. The Oxford curves retain a negative slope through the entire μ range. For comparison, the Oxford curve for.350 cm is shown (dashed) in Figure 4. The reason for this reversal is not completely clear. A similar reversal has been found in the analysis of data from Edmonton. Possibly it represents a climatological rather than physical effect. That is to say, increased atmospheric scattering due to water vapour and haze may cause the reversal at low μ.
Using the curve of Figure 4, new cloud correction charts were constructed using approximately 300 comparison observations taken throughout the period of record. In this analysis XZCCC', values were compared with "correct" XDSGQPAD, XZBAD and XZCAD values. The bulk of the comparisons were made with XZCAD values. Because the data plotted on Figure 4 were represented on a single curve, it was possible to combine the Oxford Charts II and III into a single chart which is shown in Figure 5.
The analysis suggested that the effect of cloud height on the observations was considerably less than indicated by the Oxford charts. Indeed, in preparing the final coded data, only the Low Cloud Correction Chart was used. A close examination of the final coded data later suggested that the middle and high cloud data were possibly a little low, perhaps by as much as 0.010 cm. Tentative middle and high cloud corrections have been incorporated in Figure 5 and these will be used in reducing future data on a provisional basis.
In applying the CC' charts (Figure 3 and 5) to the 300 comparison values, the following error frequencies were found:
  Error           ≤ 1%         ≤ 2%          ≤ 3%          ≤ 4%

Frequency          33%          66%          81%          89%
The 11% of the values having an apparent error greater than 4% include several observations where the total ozone is either increasing or decreasing or where light precipitation is falling. The result is encouraging when we consider that most comparisons were made against ADZC values which have a similar error frequency.
Return to Table of Contents


