The graphical system provides a flexible system to create exported data products.
This document provides some basic examples of how to use the data export interface. Changes made in the export dialog are preserved as long as CPD3 is not closed. So if you need a complex export product made repeatedly between sessions, the scripting system is likely a better way to handle that.
Basic Data Export
The most common case for data export is to simply create a file with comma separated values for a set of selected variables. To do this, start by opening the "Export Data" dialog from the "File" menu. This will open the main export data dialog with times copied from the currently visible data in the main window. Unless otherwise specified (see below) the source for data is based on the current data display mode when the dialog was openned. So, to export raw data, open the dialog from raw mode. To export hourly averaged data, first switch to averaged display mode from the "Display" menu, then open the dialog. The dialog will initially open in the input selection component.
-
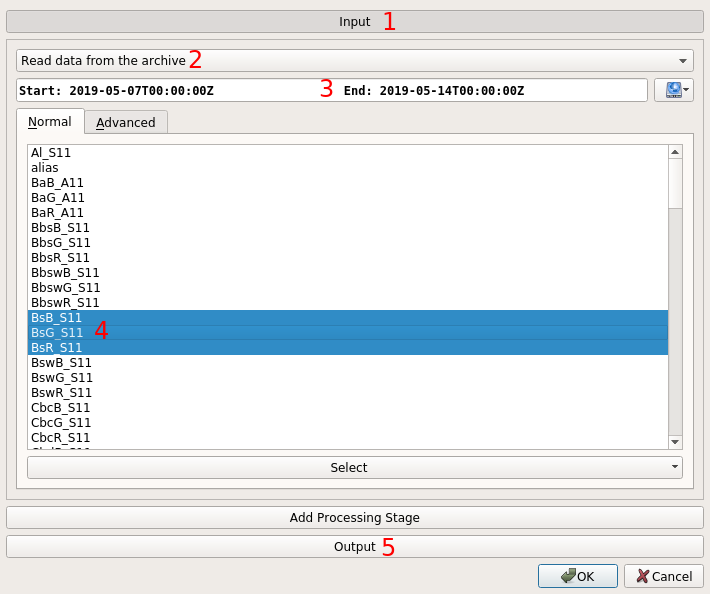
Use the "Input" button at the top is used to change the source of data to be processed. This will initially be selected when the dialog is first opened.
-
Within the input selection, the drop down below it selects the abstract "data source" that is exported. Initially, the archive source will be selected. The default archive exported is determined by the display mode when the dialog is opened.
-
Enter the time range to export. This will default to the currently visible data when the dialog was opened.
-
Select the variables to export. Clicking on a variable toggles its selection, so you can simply click on the desired variables.
-
After you have selected data, use the "Output" button near the bottom to display output parameters.
If you do not change the output mode, the data will simply be shown in another dialog. You can re-open the export dialog and it will remember the previously selected parameters, as long as the main CPD3 window has not been closed.
-
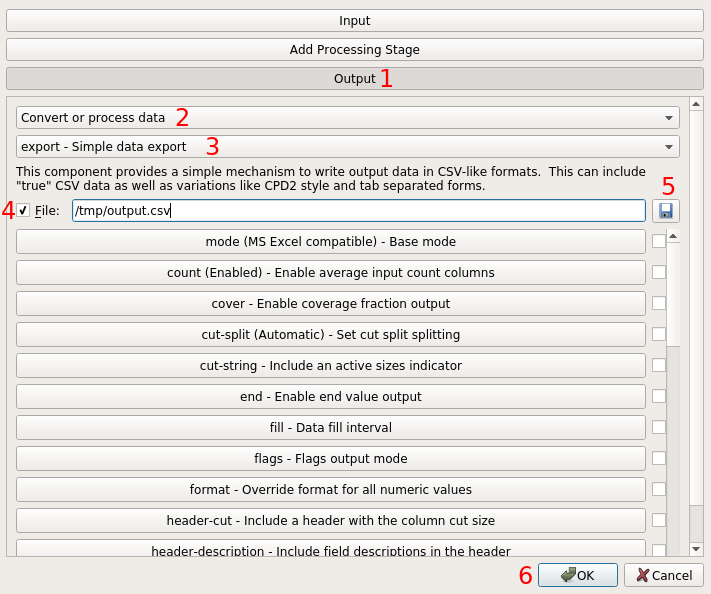
Now the dialog should be changed so that the "Output" section is selected.
-
Immediately below the output section, the first drop down allows you to select how the data are exported. Select "Convert or process data" so that data will be converted to CSV values, instead of CPD3’s native data format.
-
After changing the data processing mode, the drop down below it will change to the type of processing applied. "Export" should already be selected. This component is what is used to convert data into various CSV formats. Options for conversion appear below the selected conversion type.
-
The first option for data export is the output file. For this example, check the box next to the file name entry. If you do not check the box, then the output will be displayed in another window which you can then save.
-
Use the "disk" button to the right of the file name entry to select the file to write to. Here you should give the file a ".csv" extension to make sure it is recognized as the correct file type.
-
Finally press the "Ok" button at the bottom to perform the CSV data export.
After accepting the export dialog, a processing progress window may appear. Once the export is complete, the dialog will close and you can then open the file in another program.
Simple Data Averaging
Sometimes data need to be averaged before exporting. For example, exporting not-yet passed data without contamination removal (i.e. automatically flagged data kept in). To do this, the process is similar to the basic export, but involves a processing stage to export data.
Start by opening the export dialog as above.
For most averaging, you will also want to include the associated flags variable for an instrument.
This is required because this is how the system tracks contamination flagging.
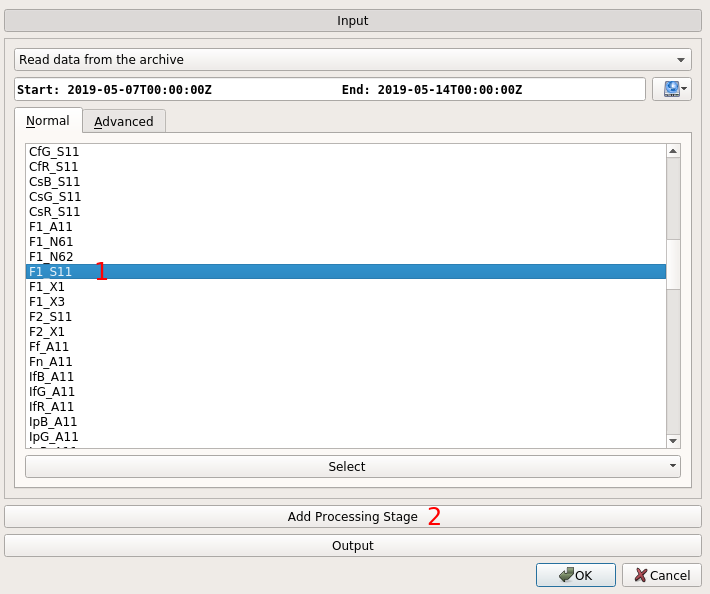
So, when exporting BsG_S11, you should also include F1_S11 to ensure proper averaging.
-
Select the associated flags variable.
-
Instead of selecting "Output" next, use the "Add Processing Stage" button to add a data transformation (averaging in this case).
|
Some variables require additiona "supporting" variables to be averaged.
For example averaging raw Another common case is wind speed and direction, where both are required to average either one (for vector calculation). If a required supporting variable is missing during averaging, the "primary" one will be set to missing values. |
-
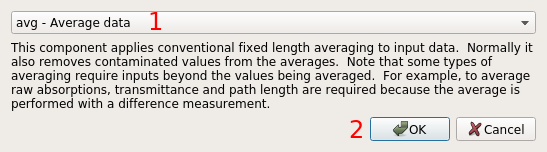
Select the "avg" component to average data.
-
Accept the added component.
-
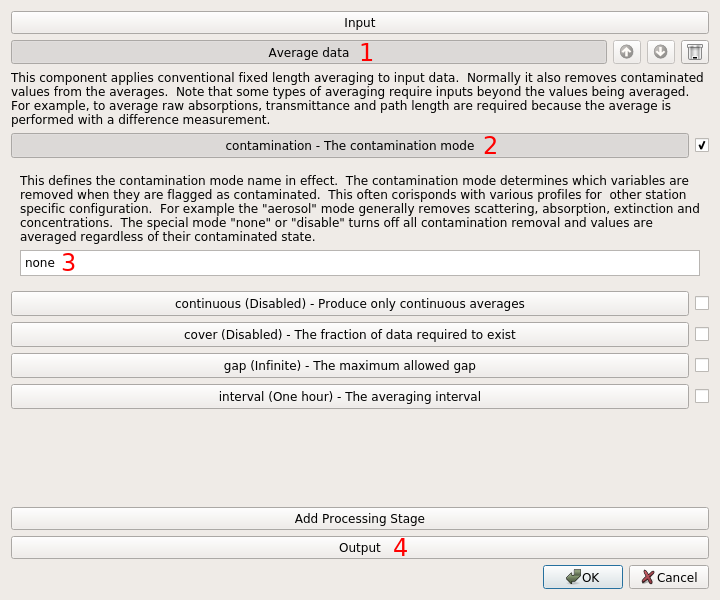
The processing stage that was just added will be selected in the dialog now. You can use the buttons to the right to change the ordering of processing or to remove the processing stage.
-
Press the "contamination" button. This will cause the checkbox to the right to be selected. The checkbox means that this option is "set" (i.e. the defaults are being overridden). The button will stay depressed and an area below the option will appear that controls the effect of the option.
-
Enter the word "none" as described in the help text above the box. This setting disables all contamination removal from averaging, so the contamination flagged data are included.
-
Press the "Output" button to proceed to normal data output as described above.
Since the default averaging is one hour, no further changes are required. However, you can select the averaging specifically with the "interval" option near the bottom.
|
There may be two scroll bars that appear on the dialog due to graphical display limitations. The inner one scrolls the options being configured (e.g. the processing stage settings). The outer one scrolls the list of stages and the input/output selection. |
Complex Data Selection
Another possible data export is to include some QA/QC’ed data (clean data) but add some variables that are not part of normal passing. To do this, you can use the "Advanced" data selection.
-
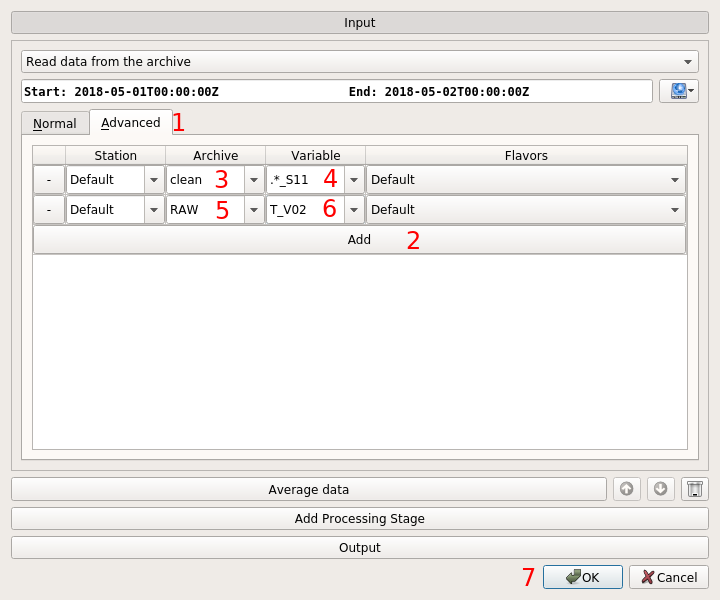
Change to the "Advanced" tab of the input selection.
-
Press the "Add" button in the table to add two rows.
-
Enter
cleanas the first archive. You may have to type it directly, since it may not appear in the list. -
Enter
.*_S11in the variable field. This is a regular expression indicating all data ending with_S11(i.e. all nephelometer data). -
Enter
rawin the second archive. -
Select a raw only variable, here a status temperature sensor is used. This status temperature does not normally occur in the clean data, but it can be exported along side the clean variables above. As with the clean archive, you may have to type the variable directly. Variables are case sensitive, while archives are not.
-
Accept the export to proceed as described above.
Edited Data Export
To export edited data that have not been passed yet, you need to use an alternate "input" source for the export processing. This has a complexity in that the way edited data are generated by the system means that all "clean" and "avgh" variables are generated at once. It’s usually necessary to filter the list of outputs after generation, so that resulting file is manageable.
-
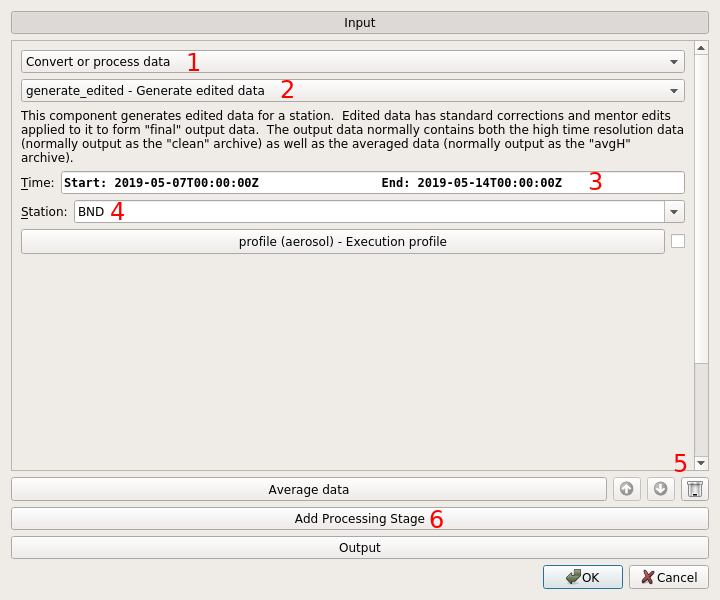
Change the input source to "Convert or process data".
-
From the list that appears below the input type selection, choose "generate_edited". This will appear near the bottom of the list, past all the acquisition data converters.
-
Enter the time range to be generated.
-
If needed, enter the station to export.
-
If you still have the averaging stage from before, use the remove button to remove it.
-
Add a new processing stage.
-
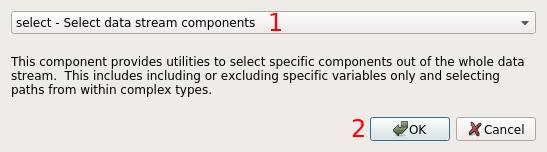
Choose "select" from the component list.
-
Accept the dialog to add the select component.
-
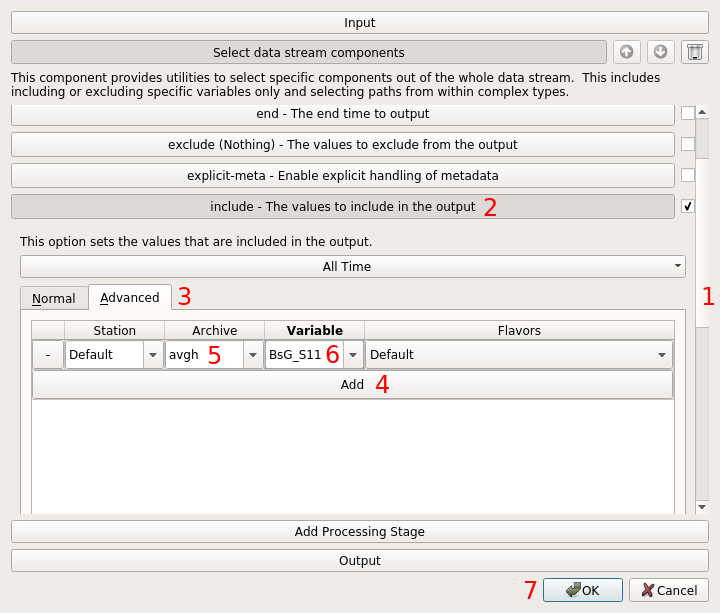
Use the (inner, if there are two) scroll bar to find the "include" option.
-
Press the "include" button to activate the data include filtering.
-
Change the the "Advanced" tab of the selection that appears below the option.
-
Add a selection.
-
Enter
avghin the archive field to select only hourly averages from the edited data being generated. -
Enter
BsG_S11to select only a single variable from all the edited data. -
Accept the export as above.