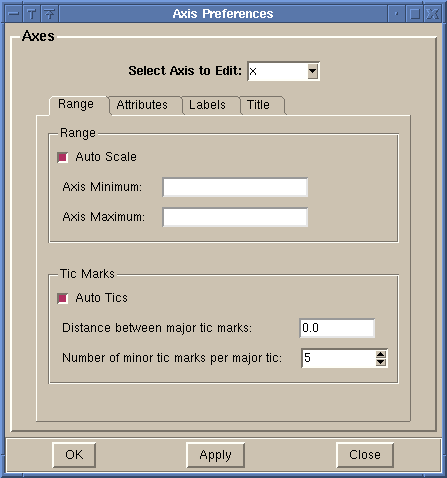
Press 'OK' to make the changes and close the dialog. Press 'Apply' to make the changes, but keep the dialog open. Press 'Close' to close the dialog and not make any changes.

- Range - Change the minimum and maximum values of the axis and the tick marks.
- Attributes - Change the color, width, and various display options for the axis.
- Labels - Change the font that is used for labelling the axis.
- Title - Change the text and the font used for the axis title.
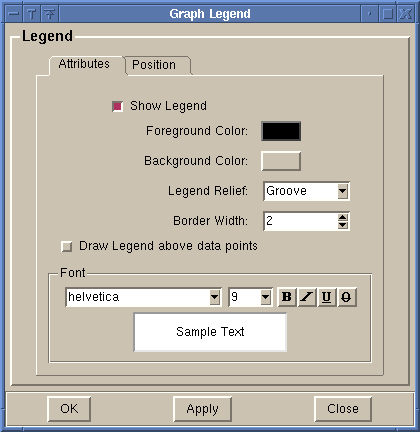
Press 'OK' to make the changes and close the dialog. Press 'Apply' to make the changes, but keep the dialog open. Press 'Close' to close the dialog and not make any changes.

- Attributes - Change the color, width, relief and font for the legend
- Position - Change the position of the legend. There are several standard locations around each side of the graph. You can also position the legend in the plotting area by choosing the 'Plot Area' option in the legend position list. You then drag the light blue box to the desired location for the legend.
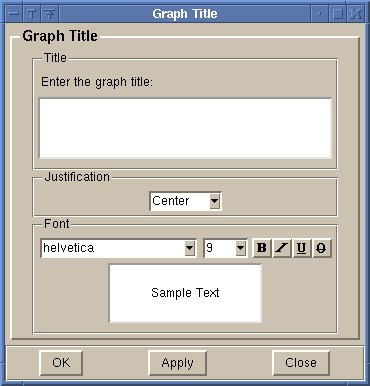
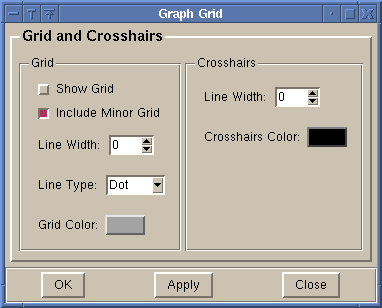
Press 'OK' to make the changes and close the dialog. Press 'Apply' to make the changes, but keep the dialog open. Press 'Close' to close the dialog and not make any changes.

