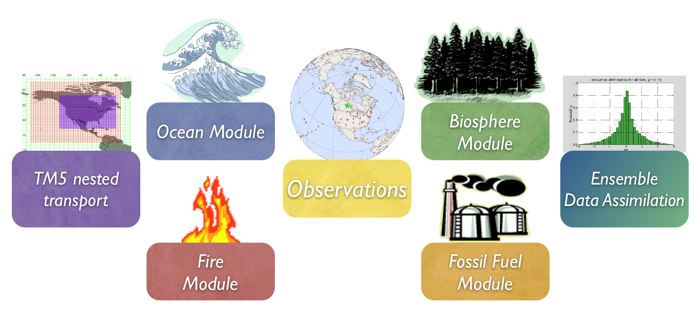
1. Introduction
The biospheric component of the carbon cycle consists of all the
carbon stored in 'biomass' around us. This includes trees, shrubs,
grasses, carbon within soils, dead wood, and leaf litter. Such
reservoirs of carbon can exchange CO2 with
the atmosphere. Exchange starts when plants take up CO2 during their growing season through the process
called photosynthesis (uptake). Most of this carbon is released back
to the atmosphere throughout the year through a process called
respiration (release). This includes both the decay of dead wood and
litter and the metabolic respiration of living plants. Of course,
plants can also return carbon to the atmosphere when they burn, as
described our fire emissions
module documentation. Even though the yearly sum of uptake and
release of carbon amounts to a relatively small number (a few
petagrams (one Pg=1015 g)) of carbon per
year, the flow of carbon each way is as large as 120 PgC each
year. This is why the net result of these flows needs to be monitored
in a system such as ours. It is also the reason we need a good
physical description (model) of these flows of carbon. After all, from
the atmospheric measurements we can only see the small net sum of the
large two-way streams (gross fluxes). Information on what the
biospheric fluxes are doing in each season, and in every location on
Earth is derived from a specialized biosphere model, and fed into our
system as a first guess, to be refined by our assimilation procedure.
2. Detailed Description
The biosphere model currently used in CarbonTracker is the Carnegie-Ames Stanford Approach (CASA) biogeochemical model. This model calculates global carbon fluxes using input from weather models to drive biophysical processes, as well as satellite observed Normalized Difference Vegetation Index (NDVI) to track plant phenology. The version of CASA model output used so far was driven by year specific weather and satellite observations, and including the effects of fires on photosynthesis and respiration (see van der Werf et al., [2006] and Giglio et al., [2006]). This simulation gives 1° x 1° global fluxes on a monthly time resolution.
Net Ecosystem Exchange (NEE) is re-created from the monthly mean CASA Net Primary Production (NPP) and ecosystem respiration (RE). Higher frequency variations (diurnal, synoptic) are added to Gross Primary Production (GPP=2*NPP) and RE(=NEE-GPP) fluxes every 3 hours using a simple temperature Q10 relationship assuming a global Q10 value of 1.5 for respiration, and a linear scaling of photosynthesis with solar radiation. The procedure is very similar, but NOT identical to the procedure in Olsen and Randerson [2004] and based on ECMWF analyzed meteorology. Note that the introduction of 3-hourly variability conserves the monthly mean NEE from the CASA model. Instantaneous NEE for each 3-hour interval is thus created as:
NEE(t) = GPP(I, t) + RE(T, t)
GPP(t) = I(t) * (∑(GPP) / ∑(I))
RE(t) = Q10(t) * (∑(RE) / ∑(Q10))
Q10(t) = 1.5((T2m-T0) / 10.0)
where T=2 meter temperature, I=incoming solar radiation, t=time, and summations are done over one month in time, per gridbox. The instantaneous fluxes yielded realistic diurnal cycles when used in the TransCom Continuous experiment.

|
|
Fig 1. Map of optimized global biosphere fluxes. The pattern of net ecosystem exchange (NEE)
of CO2 of the land biosphere averaged over
the time period indicated, as estimated by CarbonTracker. This NEE
represents land-to-atmosphere carbon exchange from photosynthesis and
respiration in terrestrial ecosystems, and a contribution from
fires. It does not include fossil fuel emissions. Negative fluxes
(blue colors) represent CO2 uptake by the
land biosphere, whereas positive fluxes (red colors) indicate regions
in which the land biosphere is a net source of CO2 to the atmosphere. Units are gC m-2 yr-1.
|
CarbonTracker uses fluxes from CASA runs for the GFED project as its
first guess for terrestrial biosphere fluxes. We have found a
significantly better match to observations when using this output
compared to the fluxes from a neutral biosphere simulation. Prior to
CT2010, we used version 2 of the CASA-GFED model, which was driven by
AVHRR NDVI,
scaled to represent MODIS fPAR. Recently the GFED team has
transitioned to version 3.1 of their model, driven directly by MODIS
fPAR. We have found that the newer CASA-GFEDv3 product has a
smaller seasonal cycle than the older CASA-GFEDv2. While we would
eventually like to use the CASA-GFEDv3 results for our first-guess
terrestrial fluxes, this will require a re-tuning of the CarbonTracker
optimization system, which is a research problem currently under investigation.
CarbonTracker 2010 is a reanalysis of the 2007-2009 period using new
fossil fuel emissions, CASA-GFEDv3 fire emissions, and first-guess
biosphere model fluxes derived from CASA-GFEDv2. Prior to 2007, the
results are identical to CT2009. For the reanalyzed period
(2007-2009), we use fire emissions from CASA-GFEDv3 but NPP and Re
from CASA-GFEDv2. This hybrid terrestrial biosphere model
approach allows us to use CASA-GFEDv2 NPP and Re for which
CarbonTracker is currently tuned, while also imposing the fire
emissions from the most up-to-date CASA-GFEDv3 model. Note that NPP
and Re are driven by real NDVI data in 2007 and 2008, while 2009 NPP and
Re fluxes are composed of the climatological prior for 2001-2008.
Use of a climatological prior is not unprecedented. For several
previous releases, we have used climatological first-guess
fluxes for the final year in the analysis cycle.
Due to the inclusion of
fires, inter-annual variability in weather and NDVI (or fPAR), the
fluxes for North America start with a small net flux even when no
assimilation is done. This flux ranges from 0.05 PgC yr-1 of release, to
0.15 PgC yr-1 of uptake.
3. Further Reading