|
Overview
Results
Resources
|
|
Statistical Evaluation - CT2011_oi
|
|
|
|
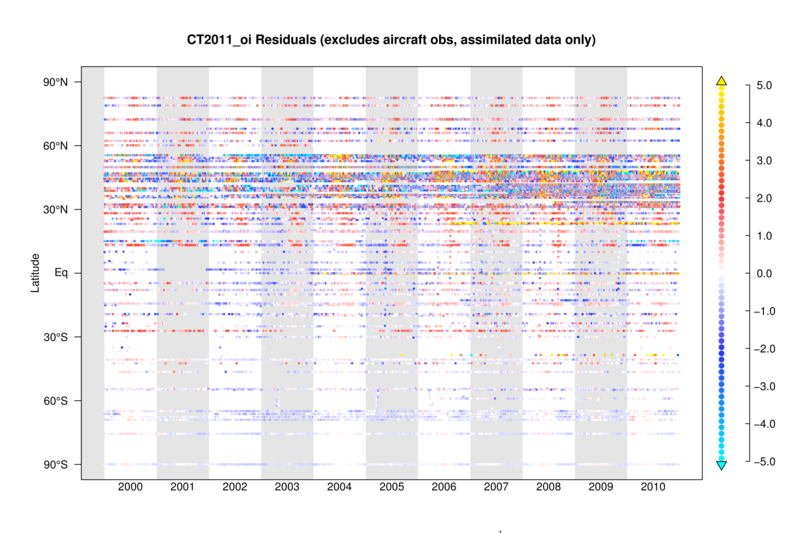
Figure 1. Summary of CarbonTracker residuals.
CarbonTracker posterior residuals (simulated minus
observed, in μmol mol-1) as a
function of time and latitude. Each dot represents the
time and location of a CO2
observation that was assimilated in CarbonTracker.
Colors represent the difference between the final
simulated value and the actual measurement, with warm
colors indicating that CarbonTracker simulates too much
carbon dioxide compared to observations, and cool colors
indicating that CarbonTracker estimates too little
CO2. Features of interest
include a seasonal cycle in northern mid-latitudes, in
which CarbonTracker has a summertime excess of carbon
dioxide compared to observations and too little in
wintertime; and a persistent underestimate of CO2 simulated in the southern
hemisphere.
|
|
|
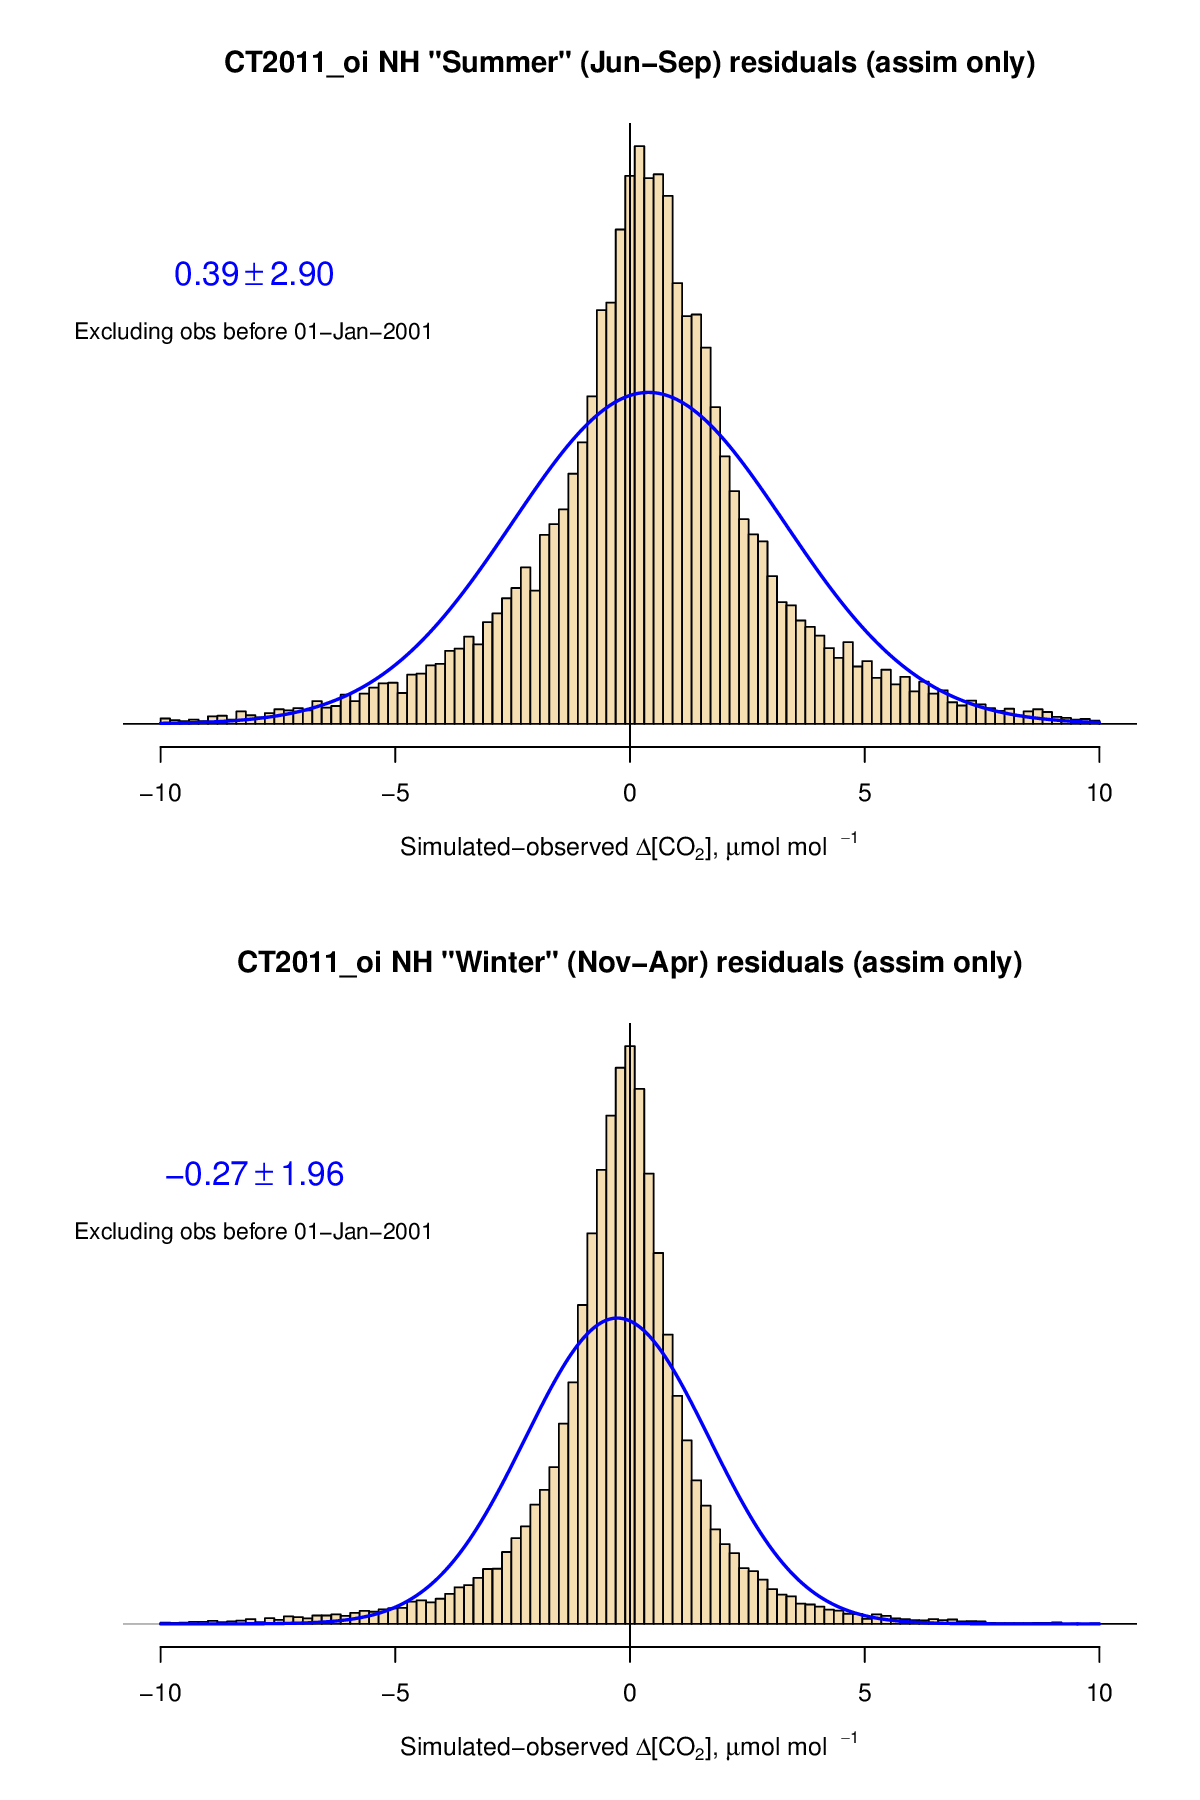
Figure 2. Seasonal histograms of northern hemisphere
residuals. As in Figure 1, posterior residuals of
assimilated CO2 mole
fractions, but only for the northern hemisphere, and
grouped by season. These histograms are intended to
highlight the seasonal cycle of CarbonTracker residuals
in the northern hemisphere.
In the northern hemisphere summer, the mean
CarbonTracker residual is about 0.6 μmol mol-1, and in the summer it is about
-0.2 μmol mol-1. While
these mean seasonal residuals are significant, the
figure also shows the strong contribution of random
error, as evidenced by the wide ranges of the
distributions. The figures shown in blue give the mean
and standard deviation of each set of residuals, and
the blue curves are the Gaussian ("normal")
distributions with equivalent statistical moments.
Notably, summertime random errors are much larger than
those in winter, due in large part to stronger
summertime variability in lower atmosphere carbon
dioxide mole fractions (cf. CO2 weather).
The residuals are tightly peaked
in the range of ± 2 μmol mol-1, with long tails of fewer
residuals at much higher values. This leptokurtic
distribution suggests that CarbonTracker is working
hard to fit large outliers, while it could extract more
information from the frequent, more modest misfits.
Outliers of more than ± 5 μmol mol-1 can easily be caused by quite
small errors in modeled transport, and are not unexpected.
|
|
|
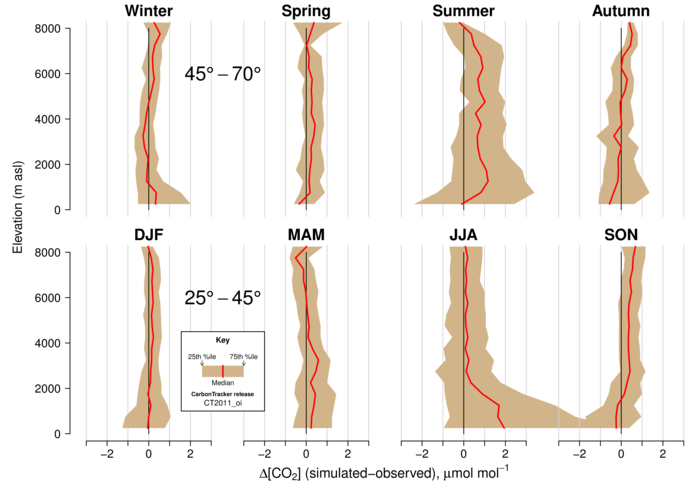
Figure 3. Summary of aircraft residuals.
Posterior residuals as in Figures 1 and 2 above, but
for aircraft data, which are not assimilated.
These data, which are mostly over North America, are
grouped by latitude band and by season. The summertime
excess of CO2 is evident in
both latitude bands, but is more closely confined to
the surface in the south whereas it is spread
throughout the column in the north. This is consistent
with the source of the error being localized to
southern band in the summer. One potential explanation
for this is that CarbonTracker underestimates the
intensity of agricultural carbon dioxide uptake.
|
|
