
| Plot interactions | |
| Zoom - | Click and drag |
| Unzoom - | Double click |
| Pan - | Shift-click and drag |
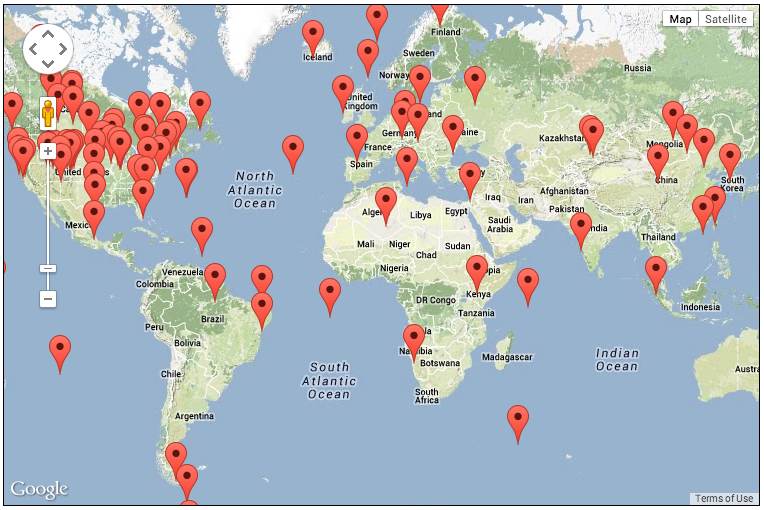
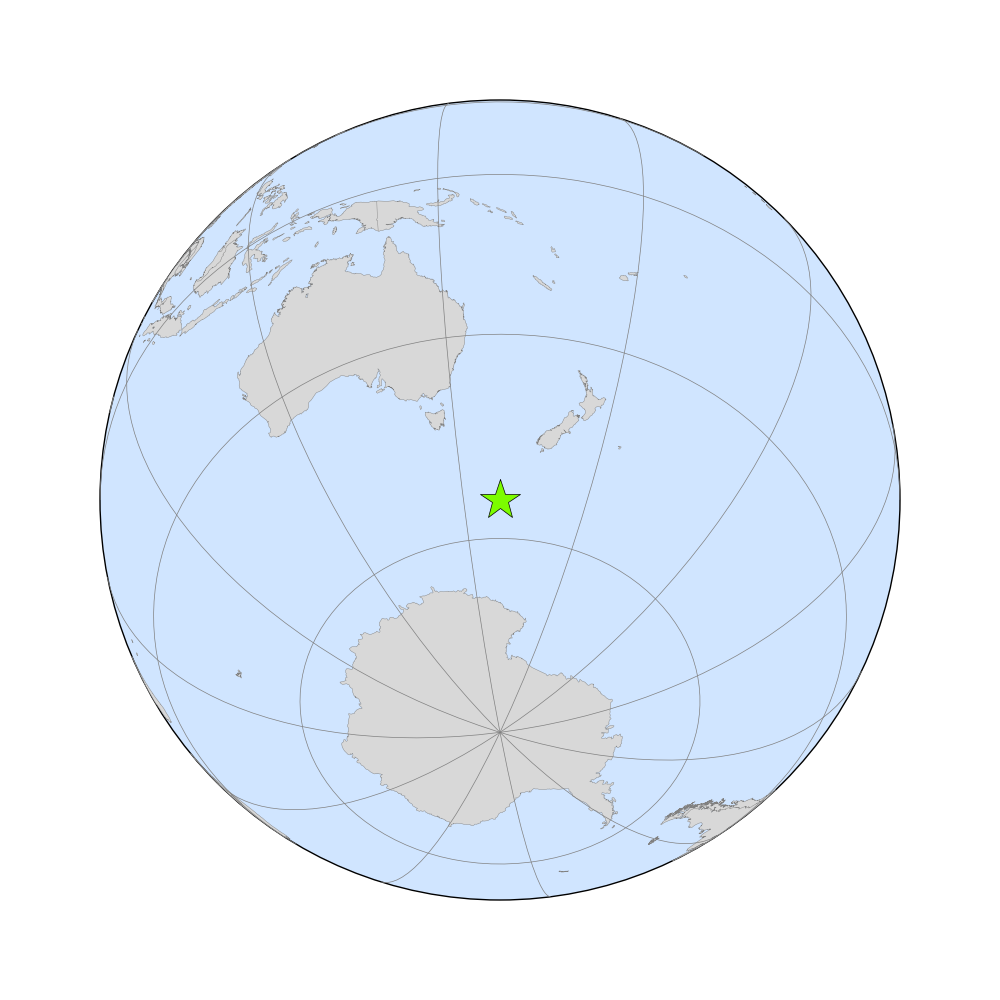
Macquarie Island, Australia
| Site Latitude | 54° 28' 58.80" S (-54.48300 °N) | |||
| Site Longitude | 158° 58' 1.20" E (158.96700 °E) | |||
| Site Elevation | 6.0 masl | |||
| Site code | MQA | |||
| Dataset | co2_mqa_surface-flask_2_representative (GLOBALVIEW identifier MQA_02D0) | |||
| Assimilated | Yes Switch to unassimilated subset | |||
| Selection scheme | Air samples are generally collected with winds from the marine sector, such that sampled air masses are free of local terrestrial influences and are representative of the background atmosphere. Where necessary, flags are applied to data that are not representative of either the background atmosphere or of the sampled air mass. | |||
| Data provider | Paul Steele, CSIRO Oceans and Atmosphere Flagship, Private Bag 1 (street address: 107-121 Station St.), Aspendale, Victoria 3195, Australia, and Paul Krummel, CSIRO Oceans and Atmosphere Flagship, Private Bag 1 (street address: 107-121 Station St.), Aspendale, Victoria 3195, Australia, and Ray Langenfelds, CSIRO Oceans and Atmosphere Flagship, Private Bag 1 (street address: 107-121 Station St.), Aspendale, Victoria 3195, Australia, and Marcel van der Schoot, CSIRO Oceans and Atmosphere Flagship, Private Bag 1 (street address: 107-121 Station St.), Aspendale, Victoria 3195, Australia | |||
| Partner(s) | No partner information available. | |||
| Laboratory |
| |||
| Download these data via ObsPack. | ||||

(c) Seasonal histograms of residuals
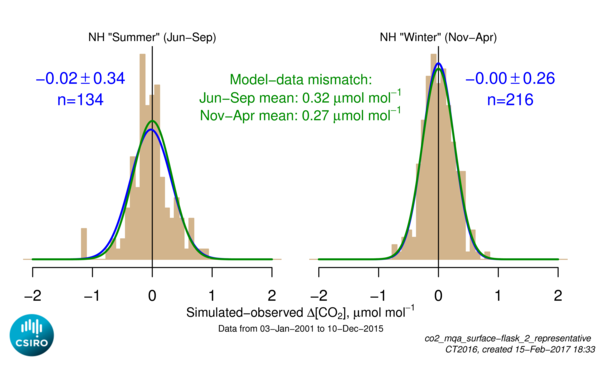
(c) Seasonal histograms of the residuals for this dataset. See caption for top figure for the definition of residuals. The left panel collects all residuals for each northern hemisphere summer (June through September); the right panel is the northern hemisphere winter (November through April). Residuals before 1 Jan 2001 are excluded from this analysis to avoid an effect of CarbonTracker burn-in from a poorly-known initial CO2 distribution. The tan color shows the histogram of the residuals themselves; the blue lines and statistics shown in blue text are a summary of the residuals interpreted as a normal distribution. For assimilated observations, the assumed model-data mismatch averaged over the seasonal span is shown in green (lines and text). The vertical scales are relative, determined by the number of observations and how tightly they are grouped, with the area under the histogram forced to unity.