|
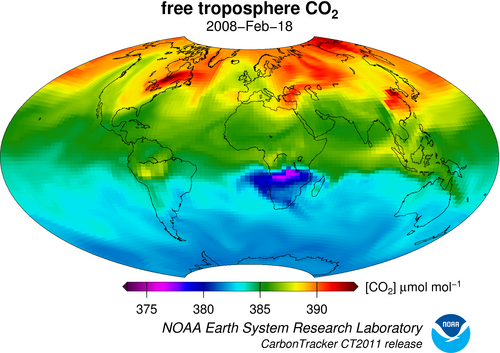
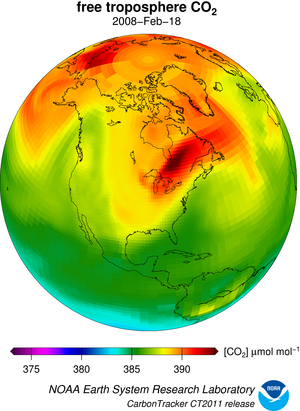
The distribution of CO2 in the atmosphere is affected by sources and sinks at the earth's surface, and by atmospheric transport (principally, winds and convection). Large scale seasonal and spatial patterns in CO2 distribution can be observed directly from observations at discrete locations, but it is also quite interesting to look at the simulated global CO2 distribution. In particular, simulations like CarbonTracker can highlight coherent short term patterns due to weather itself. The movies also show the rapid zonal mixing of the atmosphere; CO2 emitted in the USA, for example, can reach Asia in a couple weeks.
Presented here are animations of CO2
concentration in the free troposphere (above the planetary boundary
layer, but below the tropopause) as simulated by CarbonTracker. This
layer is chosen to highlight synoptic-scale variations of CO2--specifically, transport of carbon dioxide by
weather systems--without being dominated by local variations at the
surface due to regional fluxes. Technically, the plotted quantity is
the pressure-weighted average of dry mole fraction of CO2 in the model levels representing the free
troposphere. The "free troposphere" in this case is levels 5 through
10 of the TM5 model before 2005, and levels 6 through 10 after (due to
an improvement in the vertical resolution for 2006 onwards). This
corresponds to about 1.2km above the ground to about 5.5km above
ground, or in pressure terms, about 850 hPa to about 500 hPa (one
hectopascal, hPa, is equal to one millibar).
The images are created by superimposing the "zoom" region
1° longitude by 1° latitude United States grid
results onto the relatively coarse 3°
longitude by 2° latitude global grid. No lateral
interpolation is performed, so individual grid boxes can be discerned.
The movies are available in Quicktime (on this page) and animated GIF format (upon request).
Quicktime player software is available for Mac OS X and Windows from
Apple's Quicktime
page. For Linux, we recommend either MPlayer or VLC. MPlayer and VLC are
both available for Linux, OS X, and Windows.
These movies were created from the netCDF CarbonTracker output
using GMT, the netCDF operators for data manipulation, and ffmpeg to convert images to movies.
There are 2 map projections (a global Hammer projection and an
orthographic view over North America) available for each year.
|