
CarbonTracker CT2015
CarbonTracker is a CO2 measurement and modeling system developed by NOAA to keep track of sources (emissions to the atmosphere) and sinks (removal from the atmosphere) of carbon dioxide around the world. CarbonTracker uses atmospheric CO2 observations from a host of collaborators and simulated atmospheric transport to estimate these surface fluxes of CO2. The current release of CarbonTracker, CT2015, provides global estimates of surface-atmosphere fluxes of CO2 from January 2000 through December 2014.
Global CO2 budget
From 2001 through 2014, CO2 emissions to the atmosphere from burning of fossil fuels in CT2015 rose from 6.8 PgC yr-1 to 9.8 PgC yr-1 (1 petagram of carbon is 1015 gC, or 1 billion metric tons C, or 3.67 billion metric tons CO2). Global fossil fuel emissions have increased steadily year upon year, with the exception of 2008 and 2009 when emissions held nearly constant following the global economic recession (Figure 1). Fossil fuel emissions are concentrated in areas with high population density and economic activity, and emissions inventory information used in CT2015 indicates that 82% of fossil fuel emissions come from the industrialized northern extratropics.
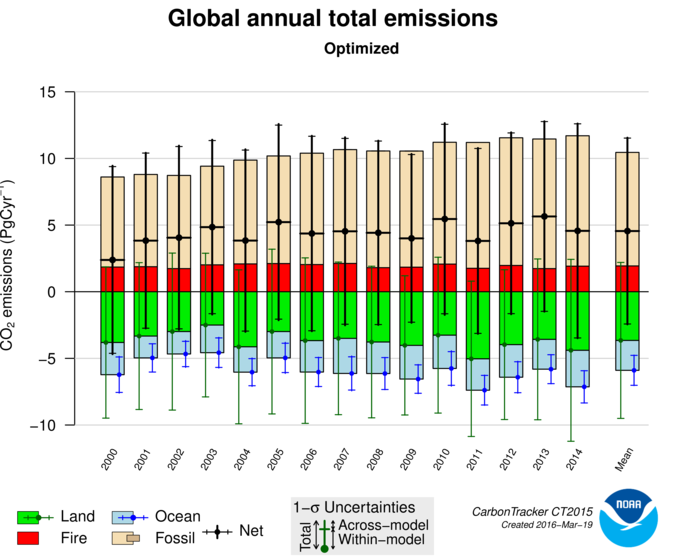
The other major source of CO2 is wildfires, which in CT2015 add an additional 1.7-2.1 PgC yr-1 to the atmosphere. In contrast to fossil fuel emissions, wildfire CO2 comes principally from tropical and southern land. 84% of wildfire emissions in CT2015 are in those regions.
Offsetting these sources are natural sinks on land and in the ocean. Together, these sinks absorb about half the anthropogenic CO2 emitted into the atmosphere. Over the period 2001-2014, the CT2015 global sum of "natural" fluxes (fire emissions, the land biosphere sink, and the ocean sink) is 49.7% of fossil fuel emissions over the same time period. The atmospheric CO2 growth rate would be about twice the observed rate without these sinks. CarbonTracker is designed to identify these sinks in order to better understand the mechanisms behind them.
According to CT2015, the world's oceans absorb 1.8 to 2.9 PgC yr-1. This natural sink exists as a direct result of increasing atmospheric CO2 concentrations, as dissolved carbon concentrations in the ocean increase to reach equilibrium with the atmosphere. However, the large-scale circulation of the ocean and biological, physical, and chemical carbon cycling cause there to be a source of carbon to the atmosphere in the tropics. In CT2015, this natural source of between 0.5 and 0.8 PgC yr-1 in the tropics is offset by large extratropical sinks of 2.6-3.4 PgC yr-1.
The terrestrial biosphere is also a net sink of CO2, due mainly to two processes. These are CO2 fertilization, in which plants grow faster since they can more easily acquire carbon dioxide for photosynthesis, and the effects of human land-use practices, including fertilization, irrigation, fire suppression, and recovery from past land use. CarbonTracker attempts to locate these land sinks spatially and temporally, so hypotheses about their mechanisms can be tested. CT2015 finds widely-scattered terrestrial CO2 sinks, with significant absorption of carbon dioxide by northern temperate and boreal regions (1.5-2.9 PgC yr-1, about 63% of the global land total of 2.4-4.9 PgC yr-1 ).
In this text, fluxes reported are reported as ranges when possible, to provide some context for how well CarbonTracker constrains the long-term average flux. These ranges are computed as the minimum and maximum values from the sequence of annual CT2015 flux estimates. A large range indicates a high degree of interannual variability in the flux estimate.
CO2 sources and sinks over North America
CT2015 results indicate that North America ecosystems have been a net sink of 0.6 ± 1.3 PgC yr-1 over the period 2001-2014. This natural sink offsets about one-third of the emissions of about 1.8 PgC yr-1 from the burning of fossil fuels in the U.S.A., Canada and Mexico combined.
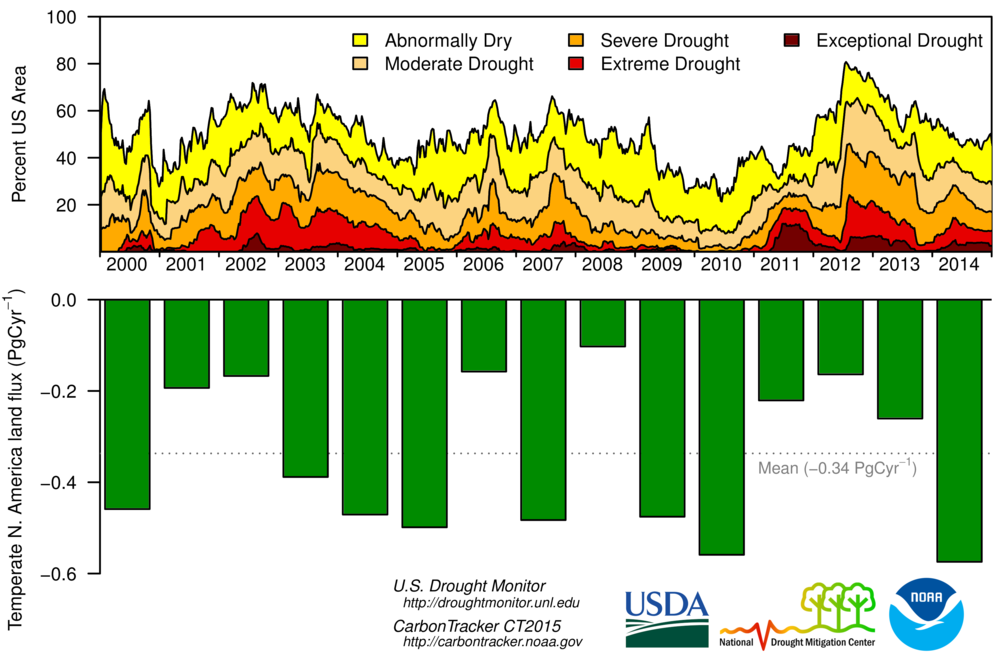
Whereas fossil emissions are generally steady over this period, ranging between 1.7 and 1.8 PgC yr-1, the amount of CO2 taken up by the North American biosphere varies significantly from year to year (Figure 2, bottom panel). In terrestrial biosphere models, inter-annual variability in land uptake can be related to anomalies in large-scale temperature and precipitation patterns. While the CarbonTracker period of analysis is relatively short compared to the dynamics of slowly-changing pools of biospheric carbon, episodes of extremes in net ecosystem exchange (NEE) have been associated with climatic anomalies (see e.g. Peters et al., 2007). CT2015 annual estimates of the land sink over temperate N. America are clearly related to continental-scale drought intensity (Figure 2). It is interesting to note that the inferred year-to-year variabilty (the "range") of land uptake is actually as big as the average sink itself.
Widespread droughts in the U.S. west and Canada during 2002 and 2012 resulted in relatively small annual uptake by terrestrial ecosystems in temperate North America (Figure 2). In these years, land ecosystems accounted for a sink of only about 0.2 PgC yr-1. This is about half the sink of an "average" year, in which these same land ecosystems remove about 0.4 PgC yr-1.
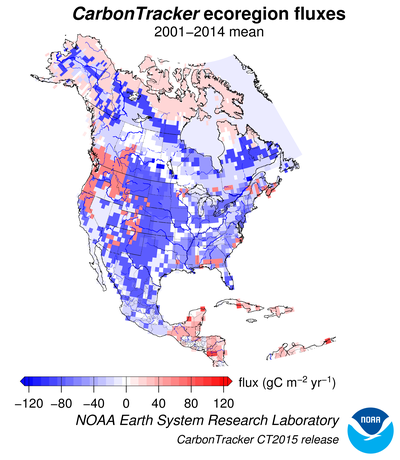
Spatial distribution of North American surface fluxes
CarbonTracker flux estimates include sub-continental patterns of sources and sinks coupled to the distribution of dominant ecosystem types across the continent (Figure 3). We have greater confidence in countrywide totals than in estimates of regional sources and sinks, but we expect that such finer-scale estimates will become more robust with future expansion of the CO2 observing nework. Our results indicate that the sinks are mainly located in the agricultural regions of the U.S. and Canadian midwest, and boreal forests in Canada.
The CarbonTracker observing system
CarbonTracker surface flux estimates are optimally consistent with 557,486 atmospheric CO2 observations from the GLOBALVIEWplus-1.0 ObsPack, comprising 298 time series datasets from around the world using a variety of measurement techniques and platforms (Table 1, Figure 4). These observation are contributed by collaborators from 32 different laboratories. CO2 observational data can be accessed by downloading the GLOBALVIEWplus-1.0 ObsPack, or if modeled observations are also required, the CT2015 ObsPack. More information on CO2 measurements used in CT2015 can be found in the observations documentation.
| Observation | Number of | Number of | Not For | Assimilation Observations | ||
|---|---|---|---|---|---|---|
| Type | Datasets | Observations | Assimilation | Total | Accepted | Rejected |
| surface-insitu | 70 | 2 778 083 | 2 364 813 | 413 270 | 411 830 | 1 440 |
| surface-flask | 132 | 41 533 | 2 059 | 39 474 | 39 140 | 334 |
| surface-pfp | 22 | 18 997 | 8 251 | 10 746 | 10 692 | 54 |
| tower-insitu | 24 | 1 386 634 | 1 294 982 | 91 652 | 90 828 | 824 |
| aircraft-pfp | 41 | 52 618 | 52 618 | 0 | 0 | 0 |
| aircraft-flask | 3 | 4 472 | 4 472 | 0 | 0 | 0 |
| aircraft-insitu | 2 | 427 034 | 427 034 | 0 | 0 | 0 |
| shipboard-flask | 2 | 2 344 | 0 | 2 344 | 2 315 | 29 |
| Total | 298 | 4 711 715 | 4 154 229 | 557 486 | 554 805 | 2 681 |
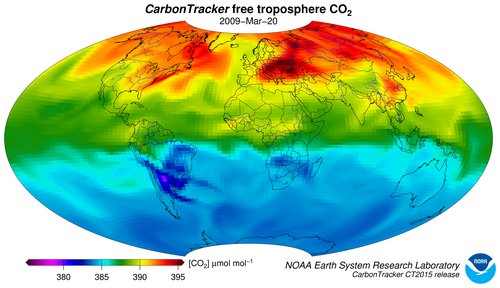
Calculated time-dependent CO2 fields throughout the global atmosphere
A "byproduct" of the data assimilation system, once sources and sinks have been estimated, is that the mole fraction of CO2 is calculated everywhere in the model domain and over the entire 2000-2014 time period, based on the optimized source and sink estimates (Figure 1). As a check on model transport properties and CarbonTracker inversion performance, calculated CO2 mole fractions are regularly compared with ~484,000 measurements from 46 aircraft datasets taken by NOAA/ESRL and collaborators. These independent samples are not used to estimate fluxes in CarbonTracker, but rather set aside for cross-validation.
Since CarbonTracker simulates CO2 throughout the entire atmospheric column, the model atmosphere can be sampled like satellite (GOSAT and OCO-2) and ground-based remote sensing instrument (TCCON) retrievals of CO2. Examples of our agreement with the latter can be found on our TCCON page.
Flux uncertainties
It is important to note that at this time the uncertainty estimates for CarbonTracker sources and sinks are themselves quite uncertain. They have been derived from the mathematics of the ensemble data assimilation system, which requires several educated guesses for initial uncertainty estimates. The paper describing CarbonTracker (Peters et al. (2007), Proc. Nat. Acad. Sci. vol. 104, p. 18925-18930) presents different uncertainty estimates based on the sensitivity of the results to 14 alternative yet plausible ways to construct the CarbonTracker system. For example, the 14 realizations produce a range of the net annual average terrestrial emissions in North America of -0.40 to -1.01 PgC -1 (negative emissions indicate a sink). The procedure is described in the Supporting Information Appendix to that paper, which is freely downloadable from the PNAS web site.
Furthermore, the estimates do not take into account several additional factors noted below. The calculation is set up for sources and sinks to slowly revert, in the absence of observational data, to first guesses of net ecosystem exchange, which are close to zero on an annual basis. This set-up may result in a bias. Also due to the sparseness of measurements, we have had to assume coherence of ecosystem processes over large distances, giving existing observations perhaps an undue amount of weight. The process model for terrestrial photosynthesis and respiration was very basic, and will likely be greatly improved in future releases of CarbonTracker. Easily the largest single annual average source of CO2 is emissions from fossil fuel burning, which are currently not estimated by CarbonTracker. We use estimates from emissions inventories (economic accounting) and subtract the CO2 mole fraction signatures of those fluxes from observations. As a result, the biosphere and ocean fluxes estimated by CarbonTracker inherit error from the assumed fossil fuel emissions. While these emissions inventories may have a small relative error on global scales (perhaps 5 or 10%), any such bias translates into a larger relative error in the annual average ecosystem sources and sinks, since those fluxes have smaller magnitudes. We expect to add a process model of fossil fuel combustion in future releases of CarbonTracker. Finally, additional measurement sites are expected to lead to the greatest improvements, especially to more robust and specific source/sink results at smaller spatial scales.
Consistency of modeled and observed atmospheric CO2 growth rates
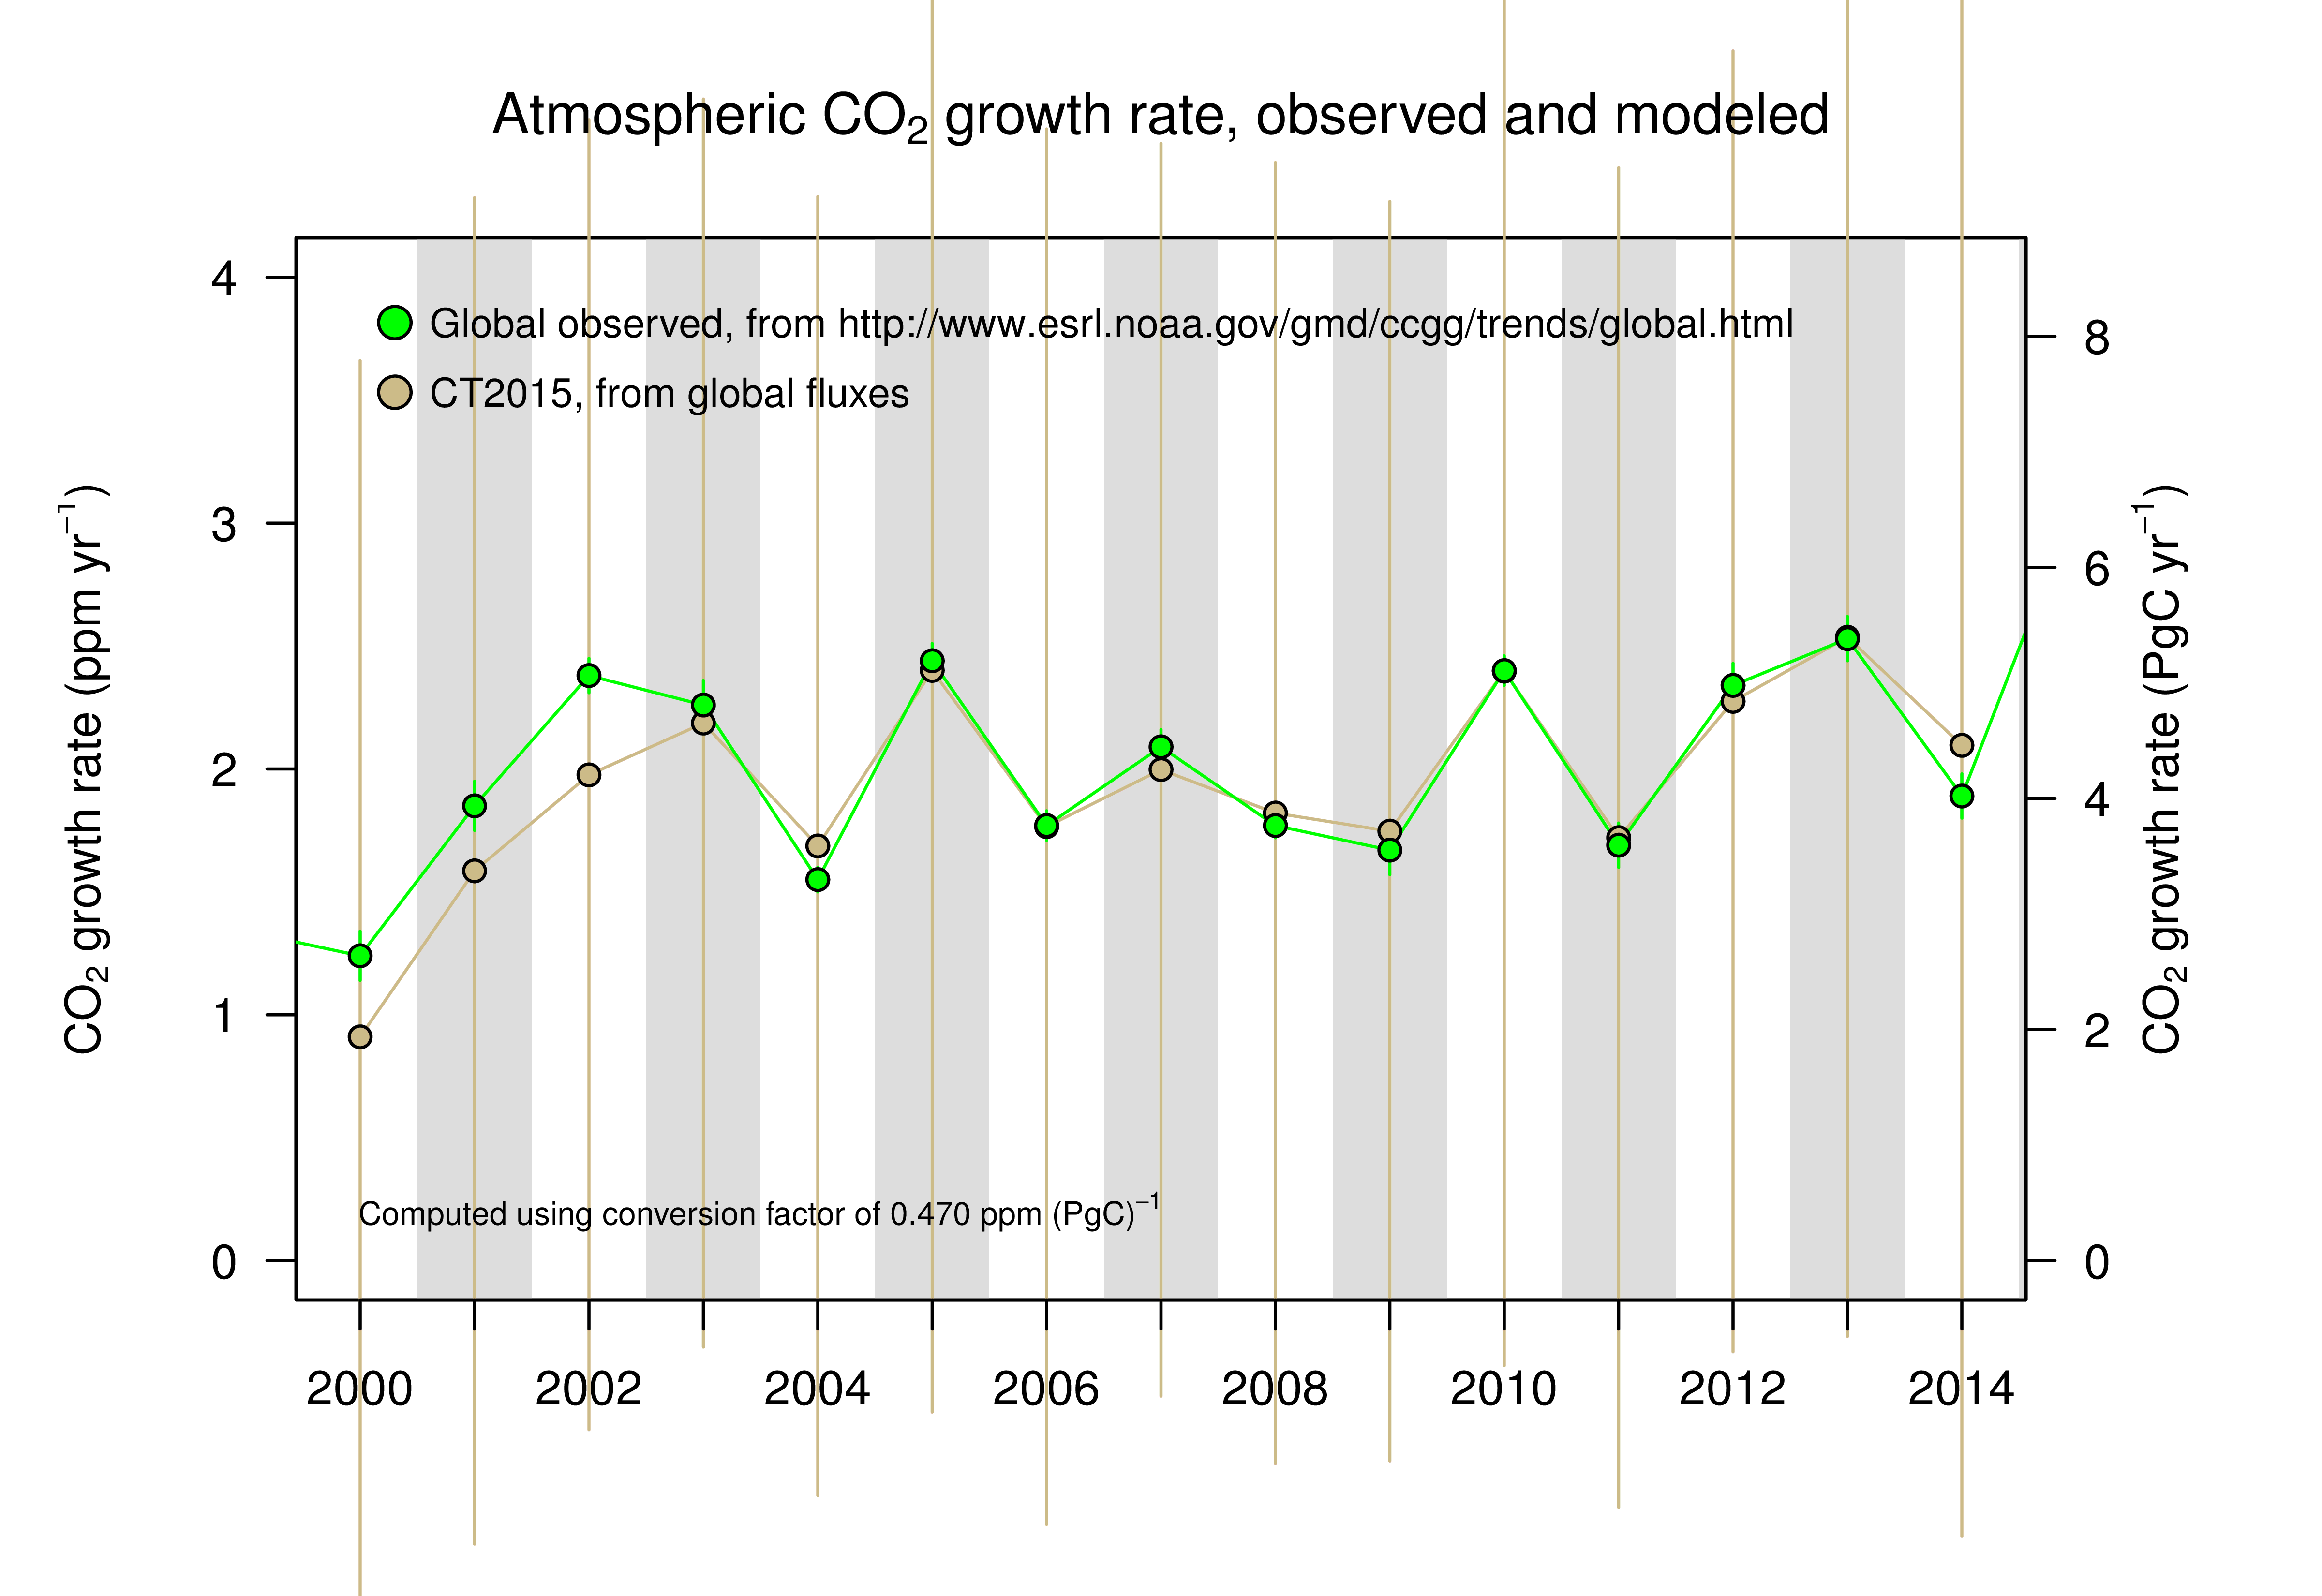
Global atmospheric CO2 growth rates inferred directly from observed carbon dioxide at marine surface sites are consistent with those modeled by CarbonTracker, both in their average values and in their year-to-year variations (Figure 6). These global growth rates continue to hover at around 4 PgC yr-1, or around 1.9 ppm yr-1 (Figure 6).
2007 CarbonTracker PNAS publication
CarbonTracker is a NOAA contribution to the North American Carbon Program
Other CarbonTrackers