CarbonTracker CT2022
CarbonTracker is a CO2 measurement and modeling system developed by NOAA to keep track of sources (emissions to the atmosphere) and sinks (removal from the atmosphere) of carbon dioxide around the world. CarbonTracker uses atmospheric CO2 observations from a host of collaborators and simulated atmospheric transport to estimate these surface fluxes of CO2. The current release of CarbonTracker, CT2022, provides global estimates of surface-atmosphere fluxes of CO2 from January 2000 through December 2020.
What is CarbonTracker?
CarbonTracker is a global model of atmospheric carbon dioxide with a focus on North America, designed to keep track of CO2 uptake and release at the Earth's surface over time. [read more]
Who needs CarbonTracker?
Policy makers, industry, scientists, and the public need CarbonTracker information to make informed decisions to limit greenhouse gas levels in the atmosphere. [read more]
What does CarbonTracker tell us?
North America is a source of CO2 to the atmosphere. The natural uptake of CO2 that occurs mostly east of the Rocky Mountains removes about a third of the CO2 released by the use of fossil fuels. [read more]
Global CO2 budget
Since the beginning of the atmospheric measurement record, annually-averaged CO2 concentrations have risen without interruption. This continuous increase is driven by the burning of fossil fuels. Over the CarbonTracker analysis period, CO2 emissions to the atmosphere from the burning of fossil fuels generally have risen year-on-year, starting at
Fossil fuel emissions are concentrated in areas with high population density and economic activity, and emissions inventory information used in CT2022 indicates that 82% of fossil fuel emissions come from the industrialized northern extratropics.
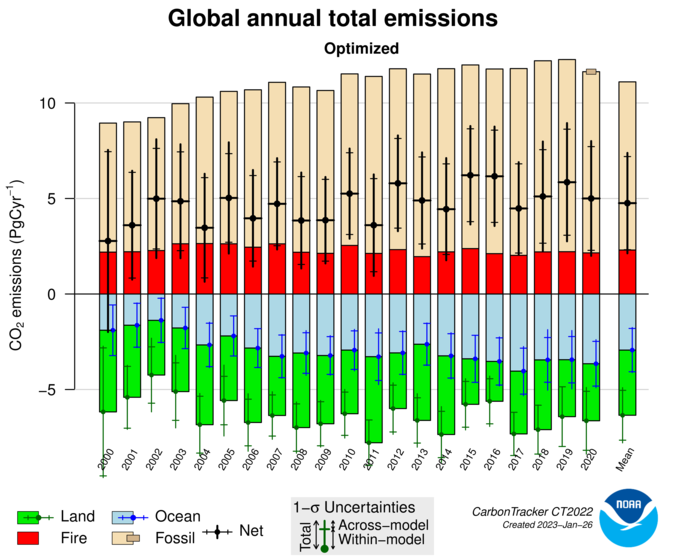
The other major source of CO2 is wildfires, which in CT2022 add an additional 2.0-2.6
Offsetting these sources are natural sinks on land and in the ocean. Together, these sinks absorb about half the anthropogenic CO2 emitted into the atmosphere. Over the period 2001-2020, the CT2022 global sum of "natural" fluxes (fire emissions, the land biosphere sink, and the ocean sink) is 46% of fossil fuel emissions over the same time period. The atmospheric CO2 growth rate would be about twice the observed rate without these sinks. CarbonTracker is designed to identify these sinks in order to better understand the mechanisms behind them.
According to CT2022, the world oceans absorb 1.4 to
4.0
The terrestrial biosphere is also a net sink of CO2, due mainly
to two processes. These are CO2 fertilization, in which plants
grow faster since they can more easily acquire carbon dioxide for photosynthesis, and the
effects of human land-use practices, including fertilization, irrigation, fire suppression,
and recovery from past land use. CarbonTracker attempts to locate these land sinks
spatially and temporally, so hypotheses about their mechanisms can be tested. CT2022 finds widely-scattered terrestrial CO2 sinks, with
significant absorption of carbon dioxide by northern temperate and boreal regions
(1.3 - 2.5
In this text, fluxes reported are reported as ranges when possible, to provide some context for how well CarbonTracker constrains the long-term average flux. These ranges are computed as the minimum and maximum values from the sequence of annual CT2022 flux estimates, often excluding the year 2000 as we consider it a spin-up year in which estimats may not be representative of the actual long-term mean. A large range indicates a high degree of interannual variability in the flux estimate.
CO2 sources and sinks over North America
CT2022 results indicate that North American ecosystems have been a net
sink of 0.7 (range 0.4 - 1.0) Pg C yr-1 over the period 2001-2020. This
natural sink offsets about one-third of the emissions of about 1.7
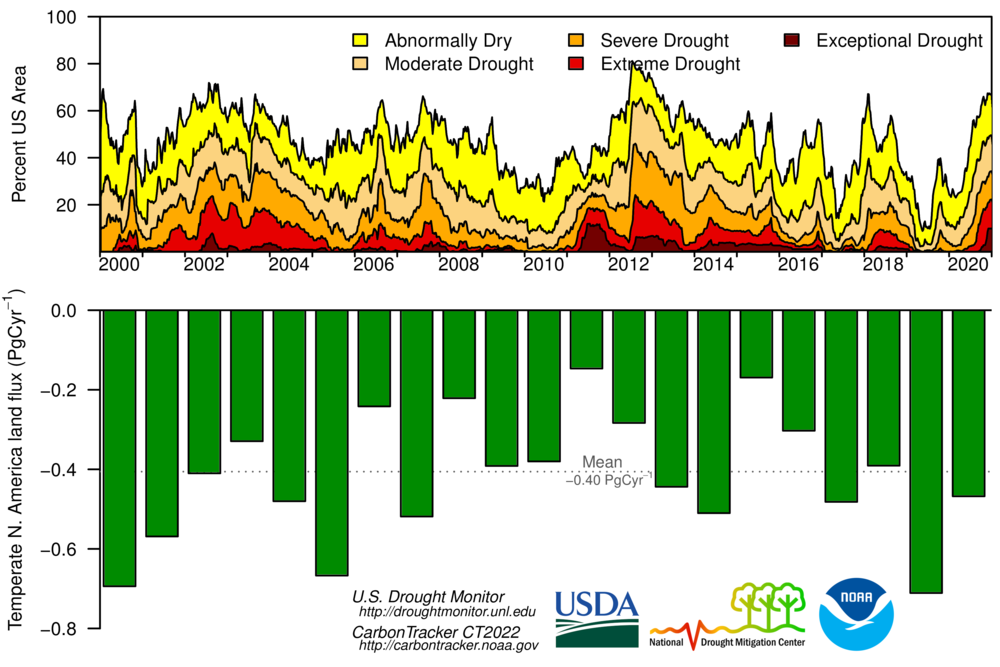
Whereas North American fossil emissions are generally steady over the CarbonTracker period, ranging between 1.4 and
1.8
Widespread droughts in the U.S. west and Canada during 2002, 2006, 2008, 2011, and 2012 resulted in
relatively small annual uptake by terrestrial ecosystems in temperate North America (Figure
2). In these years, land ecosystems accounted for a sink of only about
0.3
Spatial distribution of North American surface fluxes
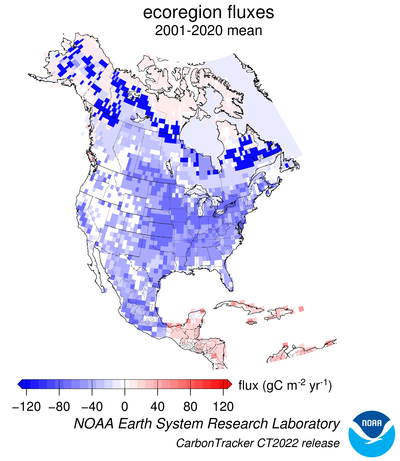
CarbonTracker flux estimates include sub-continental patterns of sources and sinks coupled to the distribution of dominant ecosystem types across the continent (Figure 3). We have greater confidence in countrywide totals than in estimates of regional sources and sinks, but we expect that such finer-scale estimates will become more robust with future expansion of the CO2 observing nework. Our results indicate that the sinks are mainly located in the agricultural regions of the U.S. and Canadian midwest, and boreal forests in Canada.
Word of caution about high-resolution biological flux maps Figure 3 shows estimated fluxes by ecoregion. While we also provide flux maps and data with a finer 1° x 1° spatial resolution, for example on our flux maps pages, these ecoregions define the actual scales at which CarbonTracker operates. With the present observing network, the detailed one-degree fluxes should not be interpreted as quantitatively meaningful for each block. Any within-ecoregion patterns come directly from results of the terrestrial biosphere model. Part of this high-resolution patterning comes from variations of temperature, precipitation, light, plant species, and soil type over each ecoregion. To spread the influence of measurements from the sparse observation network, CarbonTracker makes adjustments uniformly over an entire ecoregion. These adjustments scale the net ecosystem flux of CO2 predicted by the terrestrial biosphere model by the same factor across each ecoregion. Thus we caution that the 1° x 1° spatial detail in CarbonTracker land fluxes is based on the simulations of the terrestrial biosphere model and the assumption of large-scale ecosystem coherence. This has not been verified by observations.
The CarbonTracker observing system
CarbonTracker surface flux estimates are optimally consistent with atmospheric CO2 observations from the GLOBALVIEWplus 7.0 and 8.0 ObsPack, comprising 559 time series datasets from around the world using a variety of measurement techniques and platforms (Table 1, Figure 4). These observation are contributed by collaborators from 54 different laboratories. Most of the CO2 observational data can be accessed by downloading the GLOBALVIEWplusv8.0 ObsPack, or if modeled observations are also required, the CT2022 ObsPack. More information on CO2 measurements used in CT2022 can be found in the observations documentation.
| Observation | Number of | Number of | Not For | Assimilation Observations | ||||
|---|---|---|---|---|---|---|---|---|
| Type | Datasets | Observations | Assimilation | Total | Accepted | Rejected | Withheld | |
| surface-insitu | 209 | 9 772 615 | 8 183 700 | 1 588 915 | 1 459 324 | 51 375 | 78 216 | |
| surface-flask | 123 | 80 415 | 14 323 | 66 092 | 62 168 | 890 | 3 034 | |
| surface-pfp | 29 | 43 150 | 21 568 | 21 582 | 20 494 | 219 | 869 | |
| tower-insitu | 105 | 7 794 559 | 6 480 781 | 1 313 778 | 1 213 508 | 36 452 | 63 818 | |
| aircraft-pfp | 39 | 78 648 | 15 535 | 63 113 | 57 719 | 2 277 | 3 117 | |
| aircraft-flask | 6 | 16 032 | 12 470 | 3 562 | 3 478 | 67 | 17 | |
| aircraft-insitu | 35 | 8 131 898 | 8 031 639 | 100 259 | 93 467 | 441 | 6 351 | |
| shipboard-flask | 3 | 3 163 | 503 | 2 660 | 2 514 | 85 | 61 | |
| shipboard-insitu | 10 | 1 707 612 | 467 191 | 1 240 421 | 1 130 043 | 48 346 | 62 032 | |
| Total | 559 | 27 628 092 | 23 227 710 | 4 400 382 | 4 042 715 | 140 152 | 217 515 | |
Calculated time-dependent CO2 fields throughout the global atmosphere
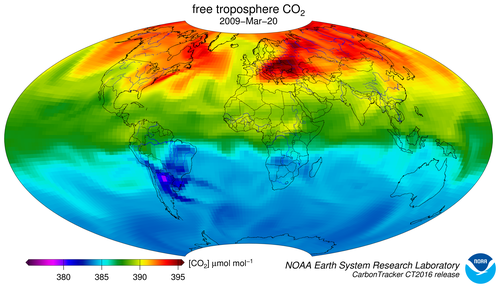
A "byproduct" of the data assimilation system, once sources and sinks have been estimated, is that the mole fraction of CO2 is calculated everywhere in the model domain and over the entire 2000-2016 time period, based on the optimized source and sink estimates (Figure 1). As a check on model transport properties and CarbonTracker inversion performance, calculated CO2 mole fractions are regularly compared with measurements from aircraft campaign datasets taken by NOAA/ESRL and collaborators. These independent samples are not used to estimate fluxes in CarbonTracker, but rather set aside for cross-validation.
Since CarbonTracker simulates CO2 throughout the entire atmospheric column, the model atmosphere can be sampled like satellite (GOSAT and OCO-2) and ground-based remote sensing instrument (TCCON) retrievals of CO2. Examples of our agreement with the latter can be found on our TCCON page.
Flux uncertainties
It is important to note that at this time the uncertainty estimates for CarbonTracker
sources and sinks are themselves quite uncertain. They have been derived from the
mathematics of the ensemble data assimilation system, which requires several educated guesses for initial uncertainty
estimates. The paper describing CarbonTracker (Peters et al. (2007), Proc. Nat. Acad. Sci. vol. 104, p. 18925-18930)
presents different uncertainty estimates based on the sensitivity of the results to 14
alternative yet plausible ways to construct the CarbonTracker system. For example, the 14
realizations produce a range of the net annual average terrestrial emissions in North America
of -0.40 to -1.01
Furthermore, the estimates do not take into account several additional factors noted below. The calculation is set up for sources and sinks to slowly revert, in the absence of observational data, to first guesses of net ecosystem exchange, which are close to zero on an annual basis. This set-up may result in a bias. Also due to the sparseness of measurements, we have had to assume coherence of ecosystem processes over large distances, giving existing observations perhaps an undue amount of weight. The process model for terrestrial photosynthesis and respiration was very basic, and will likely be greatly improved in future releases of CarbonTracker. Easily the largest single annual average source of CO2 is emissions from fossil fuel burning, which are currently not estimated by CarbonTracker. We use estimates from emissions inventories (economic accounting) and subtract the CO2 mole fraction signatures of those fluxes from observations. As a result, the biosphere and ocean fluxes estimated by CarbonTracker inherit error from the assumed fossil fuel emissions. While these emissions inventories may have a small relative error on global scales (perhaps 5 or 10%), any such bias translates into a larger relative error in the annual average ecosystem sources and sinks, since those fluxes have smaller magnitudes. We expect to add a process model of fossil fuel combustion in future releases of CarbonTracker. Finally, additional measurement sites are expected to lead to the greatest improvements, especially to more robust and specific source/sink results at smaller spatial scales.
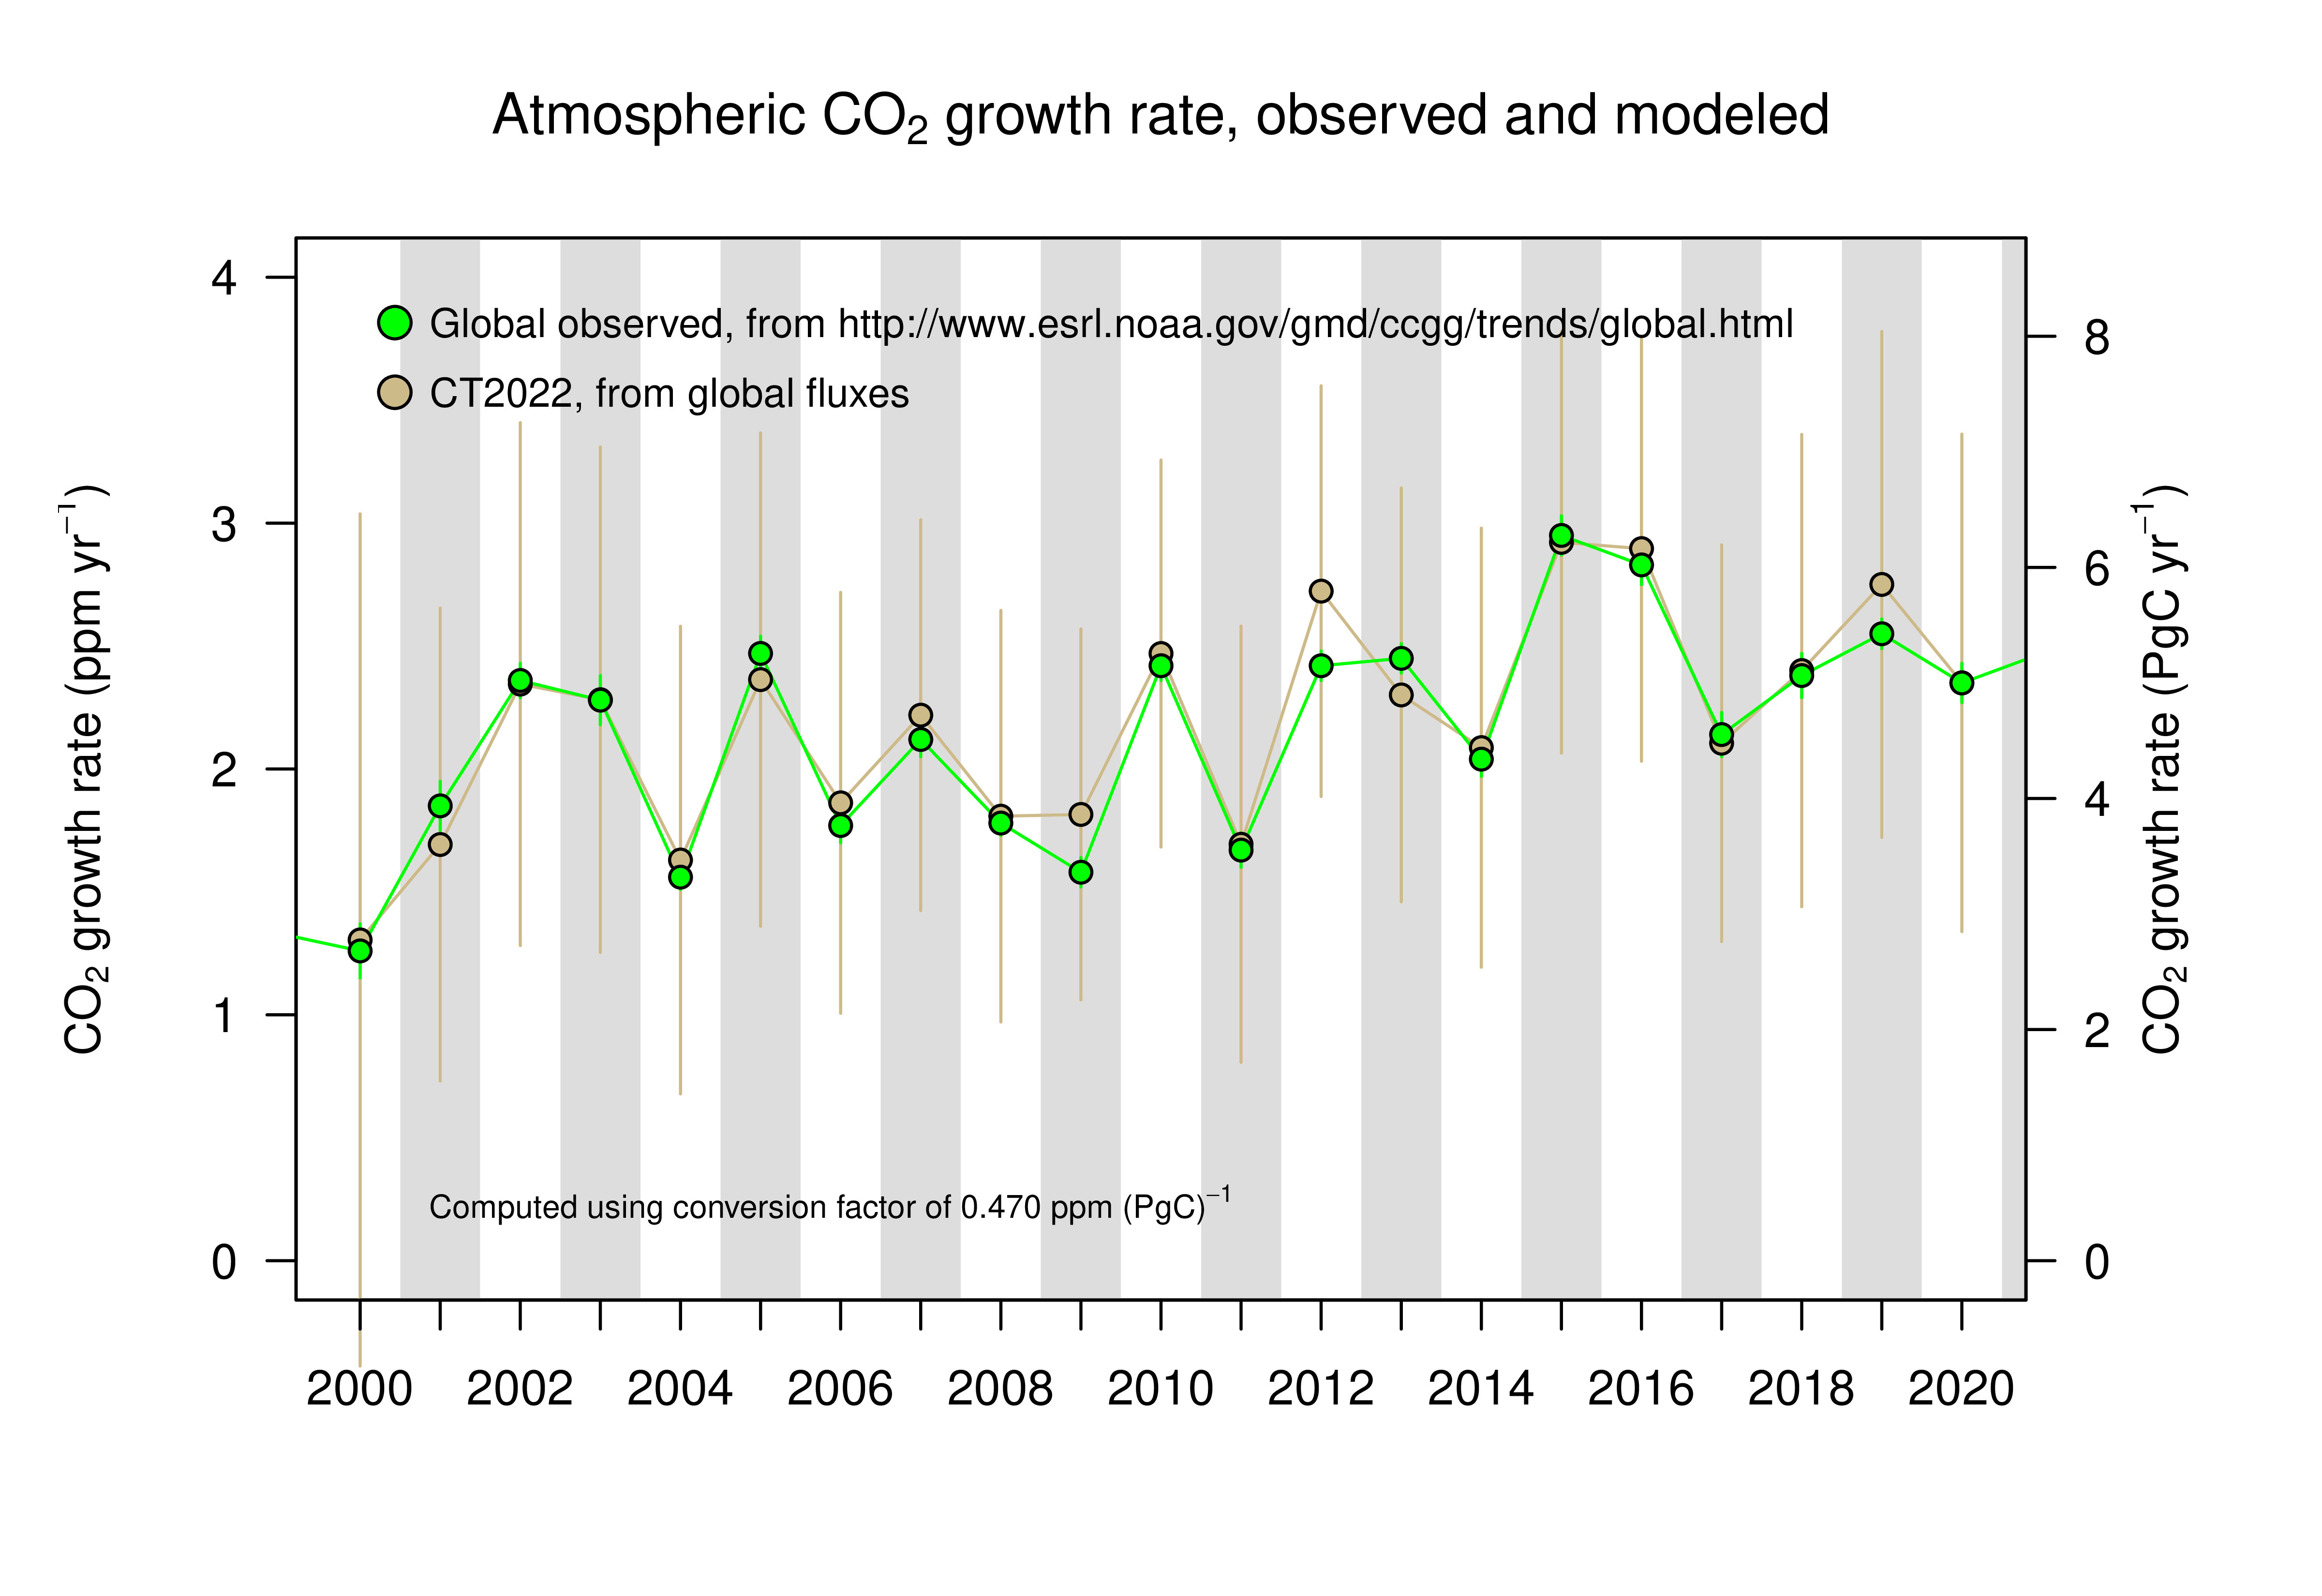
Consistency of modeled and observed atmospheric CO2 growth rates
Global atmospheric CO2 growth rates inferred directly from
observed carbon dioxide at marine surface sites are consistent with those modeled by
CarbonTracker, both in their average values and in their year-to-year variations (Figure
6). These global growth rates hovered at around
4
The 2015-2016 El Niño
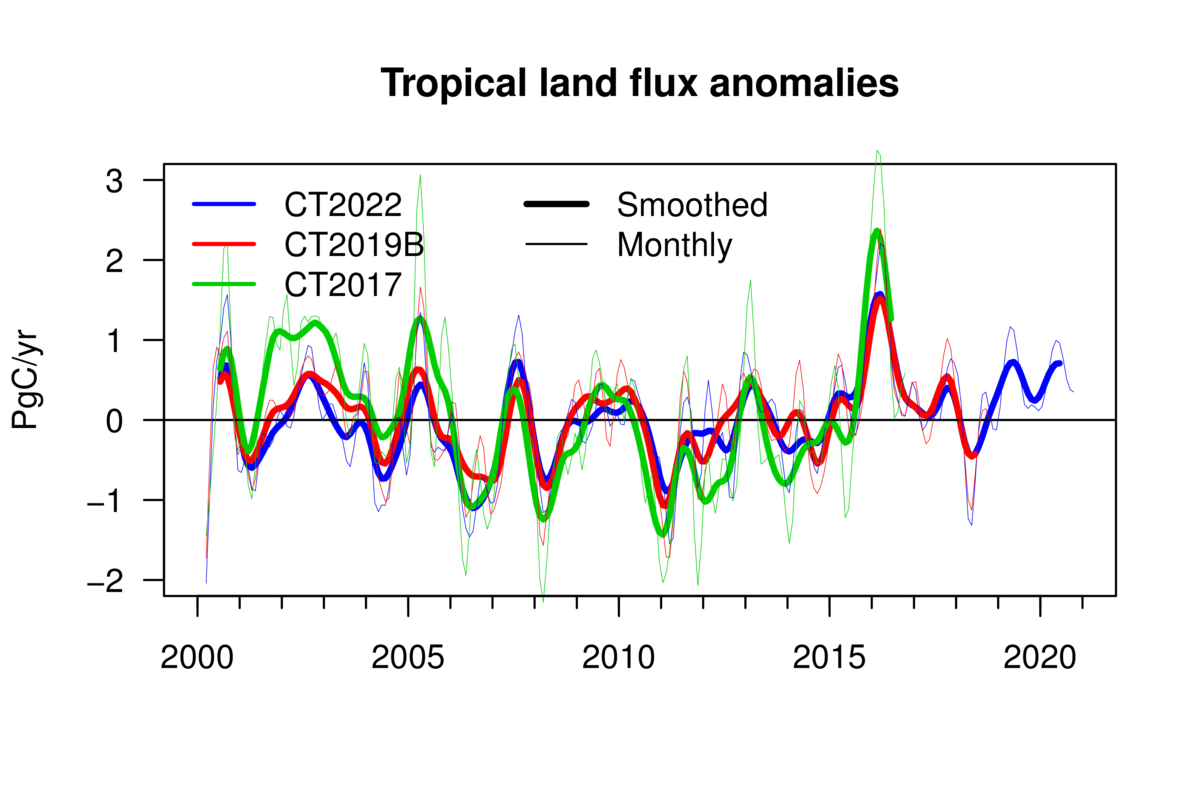
The large El Niño of 2015 and 2016 was responsible for two years of sustained record global growth rates in atmospheric
CO2 (Figure 6). With its extended assimilation window and expanded network of measurement data,
CT2019 simulates these growth rate anomalies quite well. In terms of surface fluxes, CT2019 finds that land ecosystems in the tropics
were responsible for a CO2 emissions anomaly of about
2007 CarbonTracker PNAS publication
Full bibliography of studies using CarbonTracker.
CarbonTracker is a NOAA contribution to the North American Carbon Program
Other CarbonTrackers

