noaa logo
Global Monitoring Laboratory
Earth System Research Laboratories
Menu
  • Home
  • About
    About GML Diversity, Equity, and Inclusion Science Reviews Safety Program Employment Visiting Contact Us Intranet
  • People
    Organization Staff Staff by Division Employee Spotlight
  • Research
    Research Overview Greenhouse Gases Halocarbons and Trace Gases Ozone and Water Vapor Global Radiation, Aerosols and Clouds Publications
  • Observing Networks
    Overview Observations Overview Measurement Sites Field Campaigns
    Atmospheric Baseline Observatories Observatory Operations Barrow, Alaska Mauna Loa, Hawaii American Samoa South Pole
    Observing Networks Greenhouse Gas Reference Network Halocarbons and Trace Gases Surface Radiation Federated Aerosol Network Ozone Water Vapor
  • Data
    Data Browse Data Archive Search for Data Data by Research Program Measurement Sites ObsPack Tools Data Viewer Solar Calculator Visualization Data Visualization Pages South Pole Ozone Hole
  • Products
    Products Greenhouse Gas Index Ozone Depletion Index Power of Greenhouse Gases Trends in CO2, CH4, N2O, SF6 CarbonTracker US Potent GHG Tracker ObsPack Mauna Loa Apparent Transmission Barrow Snow Melt Dates South Pole Ozone Hole
    Calibration Facilities WMO Central Calibration Laboratory Central UV Calibration Facility Broadband Solar Calibration Facility World Dobson Ozone Calibration Centre
  • Information
    News Seminars Education/Outreach Student Opportunities FAQ's Publications Webcams South Pole Webcam Mauna Loa Webcams Barrow Webcam Global Monitoring Annual Conference
    GMAC
    The 51st Conference will be
    held May 23 - 24, 2023
  1. Carbon Cycle Greenhouse Gases CCGG
  2. CarbonTracker CT2022
  3. Fluxes
  • Home
    Sites
    Datasets
    Data Viewer
    News
    Reference Network About the Reference Network Cooperative Sampling Network In-Situ Measurements Aircraft Measurements AirCore Sampling System
    Data Data Summary Trends in CO2, CH.4, N2O, SF6 Observation Package Marine Boundary Layer Reference
    Products CarbonTracker CO2 CarbonTracker CH4 CarbonTracker Lagrange Power of Greenhouse Gases Greenhouse Gas Index
    Information Figures Education How CO2 is Measured Isotope Measurements WMO Standard Gas Comparisons
CT2022
Home FAQ Documentation Tutorial Collaborators Versions
Results
Evaluation Fluxes Observations Mole Fractions Download
Resources
How to Cite E-mail List Contact Us CT on YouTube Glossary References Bibliography
Fluxes
  • Tables listing current CarbonTracker flux estimates and comparing with earlier releases.
  • Interactive tool for comparing current CarbonTracker flux estimates with earlier releases.
  • Flux Maps and Tables
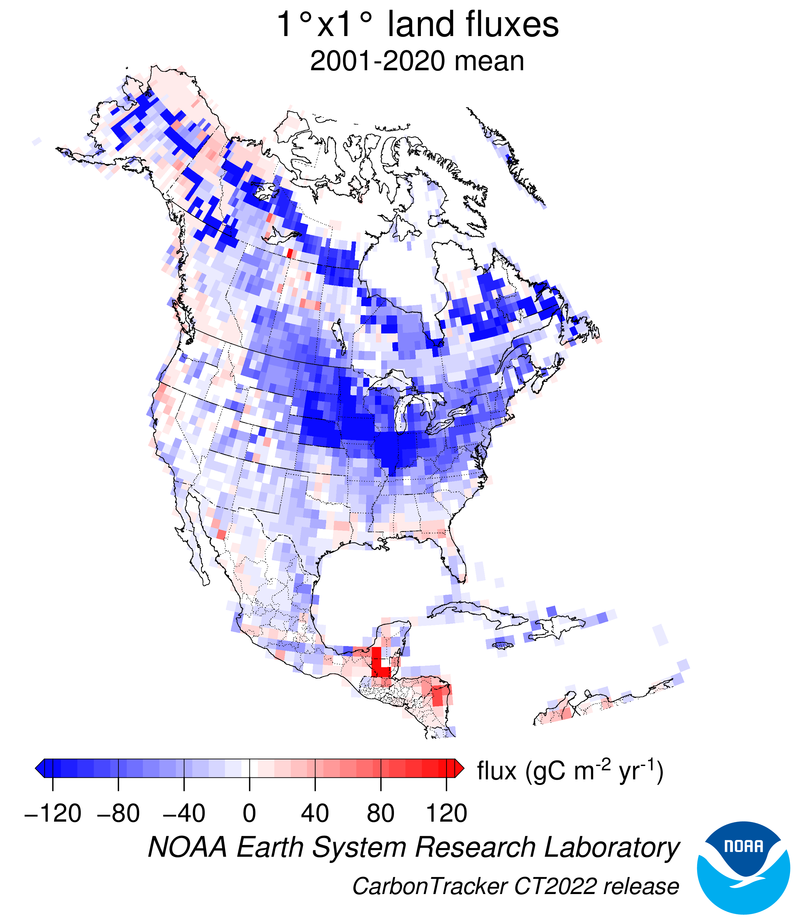
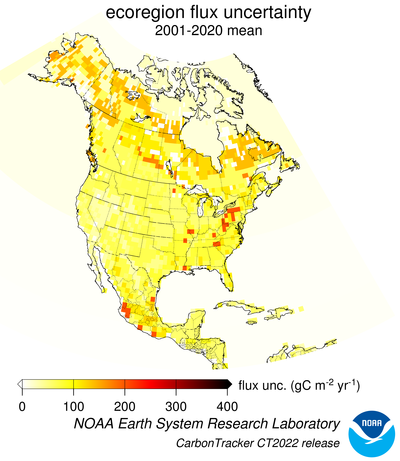
    Flux maps illustrate the estimated biological CO2 surface exchange for every week, month and year of CarbonTracker. The integrated totals of the maps shown are summarized in tables on each page.


  • Flux Time Series
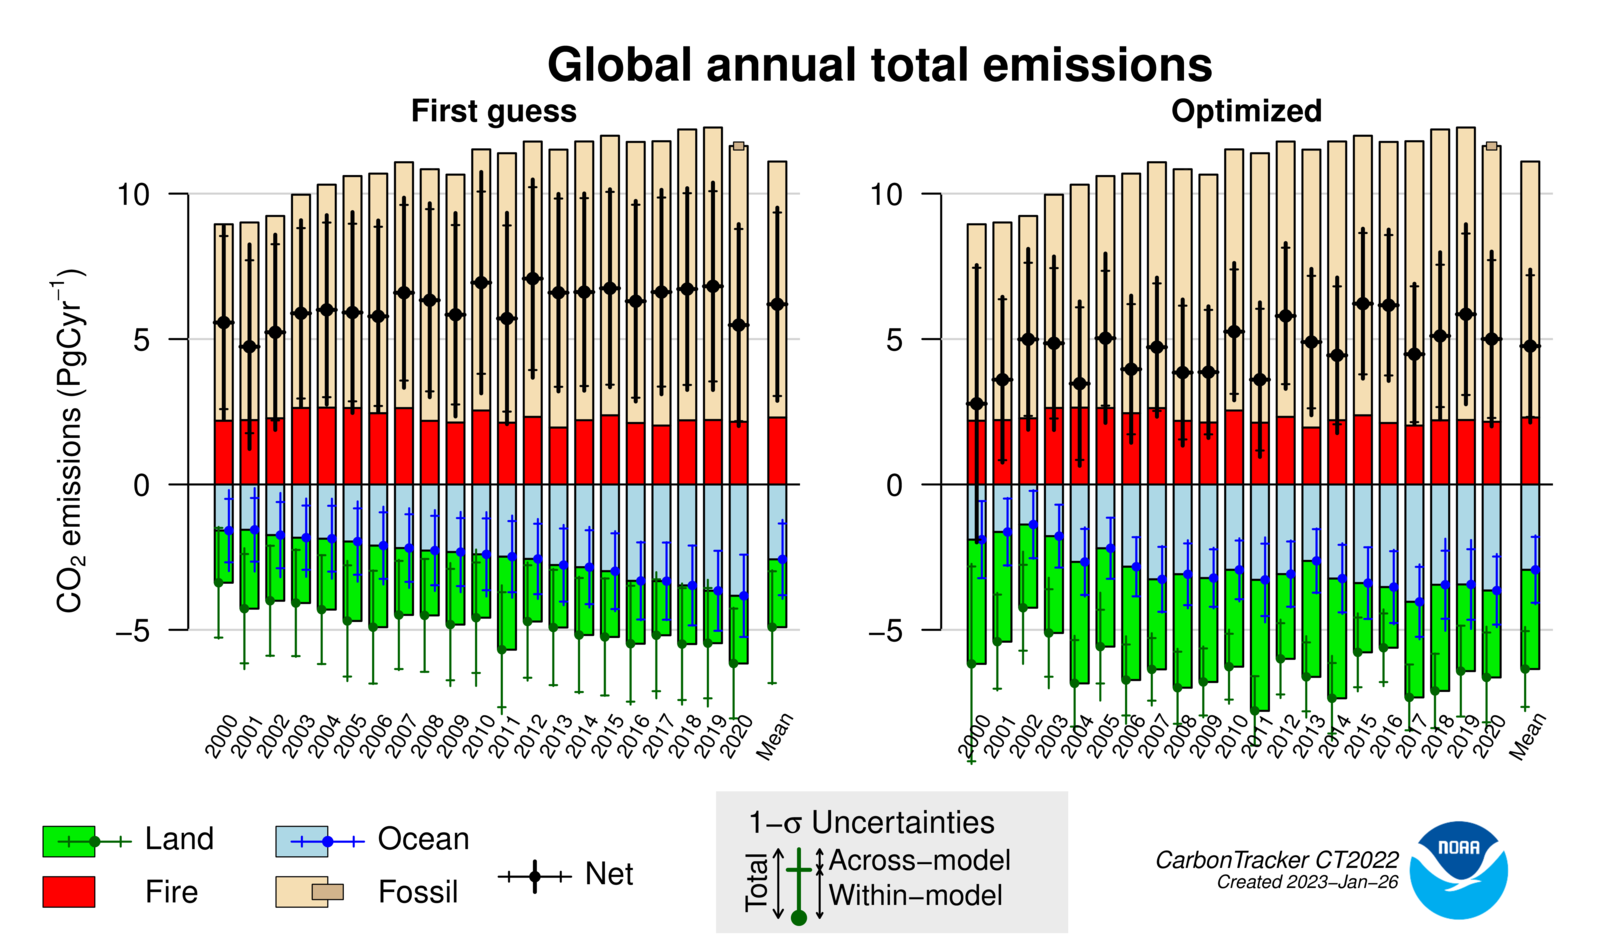
    Flux time series show the evolution of CO2 surface exchange over time. Emissions have been integrated to larger regions representing relevant continents or ocean basins. Available regions correspond to those defined in the TransCom intercomparison project.


  • Flux Time Series by Country
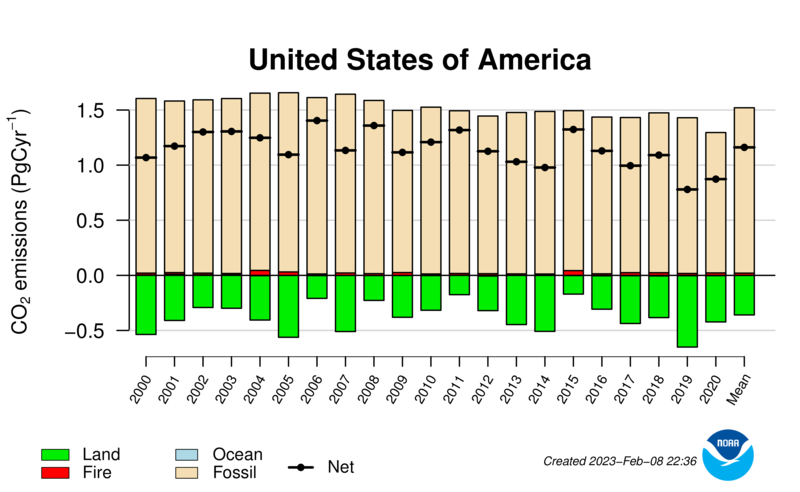
    Flux time series by country and country group show the evolution of CO2 surface exchange over time. Emissions have been integrated to larger countries and country groups.


  • Download flux data from our ftp server
  • Research
  • Data
  • Observatory Operations
  • Education
  • News
  • Publications
NOAA logo

Earth System Research Laboratories
Global Monitoring Laboratory

Privacy Policy  |   Accessibility  |   Disclaimer  |   Usa.gov


Site Contents

Contact Us  |  Webmaster

  1. U.S. Department of Commerce
  2. National Oceanic & Atmospheric Administration
  3. NOAA Research