
| Plot interactions | |
| Zoom - | Click and drag |
| Unzoom - | Double click |
| Pan - | Shift-click and drag |
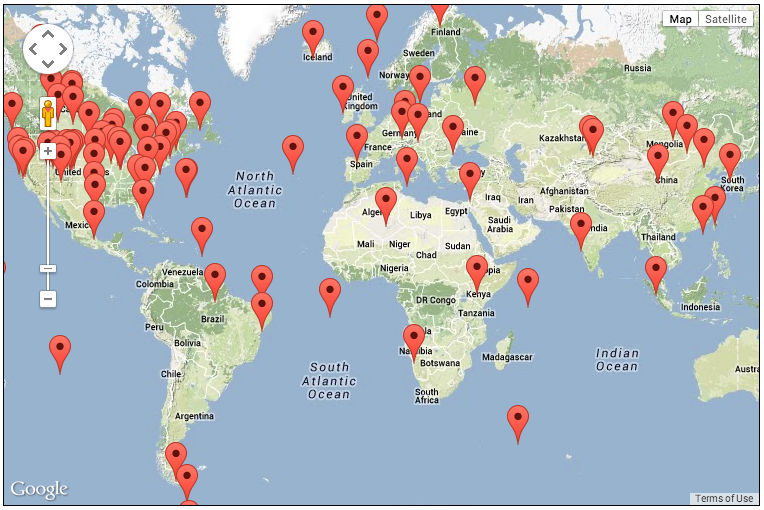
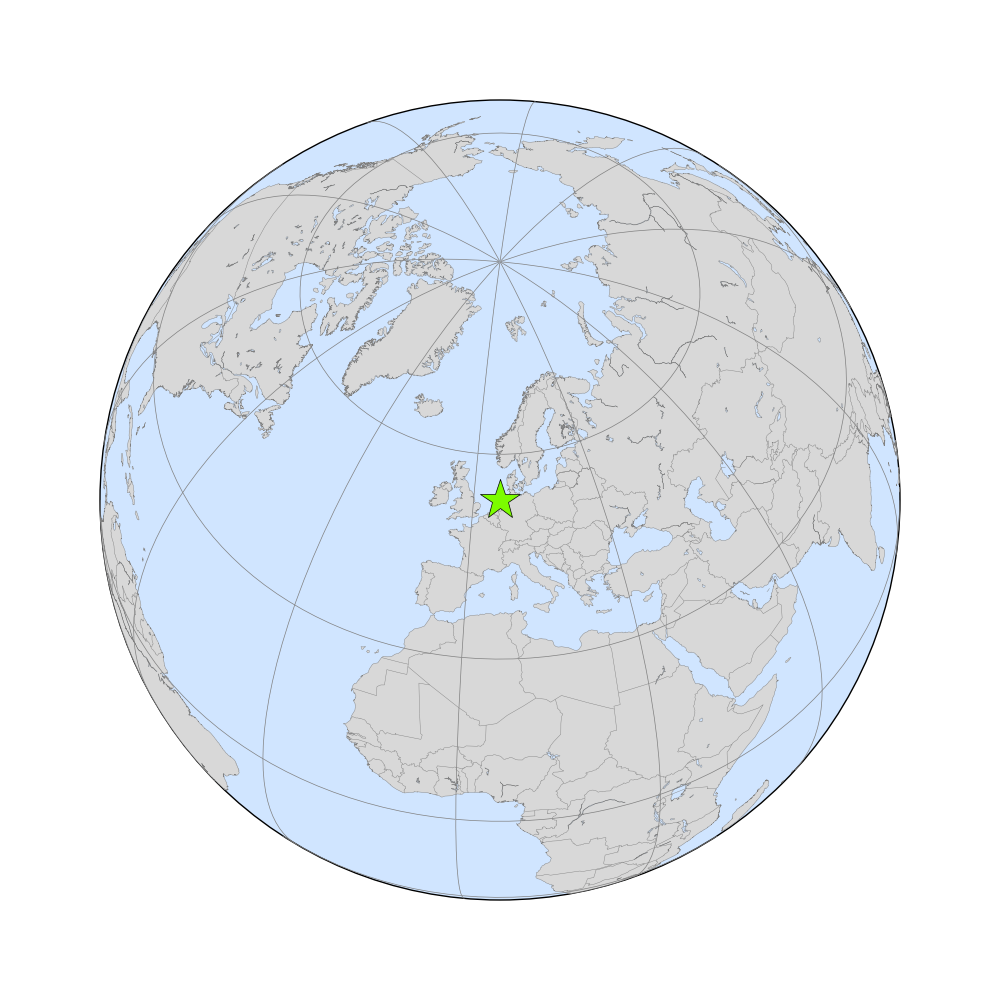
Lutjewad, Netherlands
| Site Latitude | 53° 24' 13.32" N (53.40370 °N) | |||
| Site Longitude | 6° 21' 10.44" E (6.35290 °E) | |||
| Site Elevation | 1.0 masl | |||
| Site code | LUT | |||
| Dataset | co2_lut_surface-insitu_44_allvalid (GLOBALVIEW identifier LUT_44C0) | |||
| Assimilated | Yes Switch to unassimilated subset | |||
| Selection scheme | all hourly data | |||
| Data provider | Harro Meijer, Centre for Isotope Research, University of Groningen, Nijenborgh 4, 9747AG Groningen, Netherlands, and Huilin Chen, Centre for Isotope Research, University of Groningen, Nijenborgh 4, 9747AG Groningen, Netherlands, and Bert Scheeren, Centre for Isotope Research, University of Groningen, Nijenborgh 4, 9747AG Groningen, Netherlands, and Sander van der Laan, Centre for Ocean and Atmospheric Sciences, School of Environmental Sciences, University of East Angl, Norwich Research Park, Norwich, Norfolk, NR4 7TJ, United Kingdom | |||
| Laboratory |
| |||
| Download these data via ObsPack. | ||||

(c) Seasonal histograms of residuals

(c) Seasonal histograms of the residuals for this dataset. See caption for top figure for the definition of residuals. The left panel collects all residuals for each northern hemisphere summer (June through September); the right panel is the northern hemisphere winter (November through April). Residuals before 1 Jan 2001 are excluded from this analysis to avoid an effect of CarbonTracker burn-in from a poorly-known initial CO2 distribution. The tan color shows the histogram of the residuals themselves; the blue lines and statistics shown in blue text are a summary of the residuals interpreted as a normal distribution. For assimilated observations, the assumed model-data mismatch averaged over the seasonal span is shown in green (lines and text). The vertical scales are relative, determined by the number of observations and how tightly they are grouped, with the area under the histogram forced to unity.