APPENDIX D
CALIBRATING A SPECTROPHOTOMETER ON AN ABSOLUTE SCALE
1. Direct Calibration of Spectrophotometers
Before a spectrophotometer calibrated accurately on a relative scale can be used for total ozone measurements, its "extra-terrestrial constants" at the A, B, C, and D wavelengths must be known. These constants have been determined, for example, for the World Primary Standard Spectrophotometer No. 83 located at NOAA, Air Resources Laboratory, Boulder, from observations made at Mauna Loa Observatory, Hawaii, in 1972 and 1976. To calibrate a new spectrophotometer on an absolute scale, it is sufficient to wheel that instrument alongside the standard instrument and make a series of comparative observations on A, B, C, and D wavelengths with the two instruments over a mu range of 1.15 to 5. Corrections to the uncalibrated instrument's optical wedge density (G) tables, or tentatively established N tables, are then deduced directly from the comparison data. A more sophisticated analysis of the comparison data can yield useful information about other optical characteristics of the instrument being calibrated.
In 1977, the World Meteorological Organization designated a set of Secondary Standard Spectrophotometers to serve as calibrators of field Dobson ozone instruments within their respective regions. The Secondary Standard instruments are
Inst. No.         Country            Inst. No.           Country
  105            Australia              112               India
   77             Canada                116               Japan
   96             Egypt                  41                U.K.
   71             G.D.R.                108              U.S.S.R.
In August 1977,* these spectrophotometers were calibrated relative to Primary Standard Spectrophotometer No. 83, at Boulder, Colorado, with the intention that at periodic intervals thereafter, each Secondary Standard instrument would be used in an ongoing program to calibrate and maintain in calibration "working" spectrophotometers located within its region.
*[U.S.S.R. Dobson instrument No. 108 was calibrated relative to the World Primary Standard instrument No. 83 in October, 1978.]
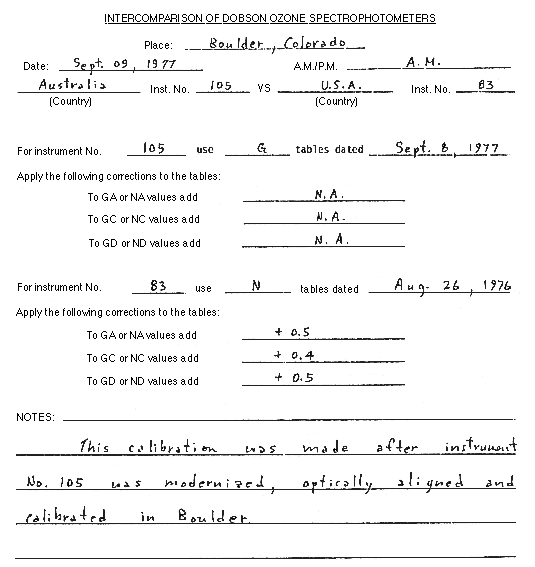
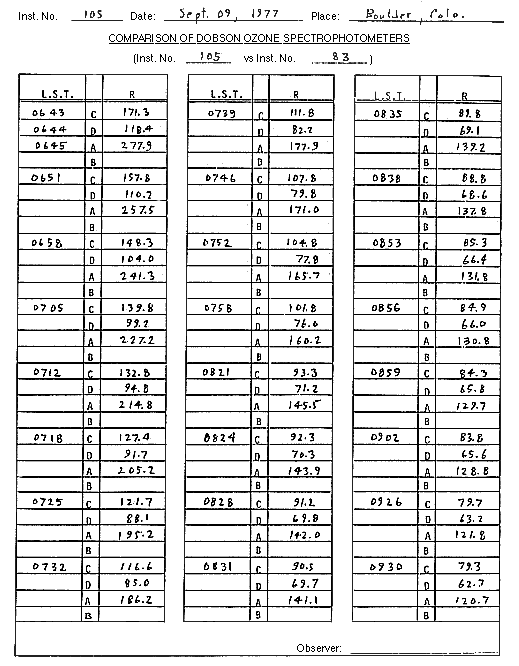
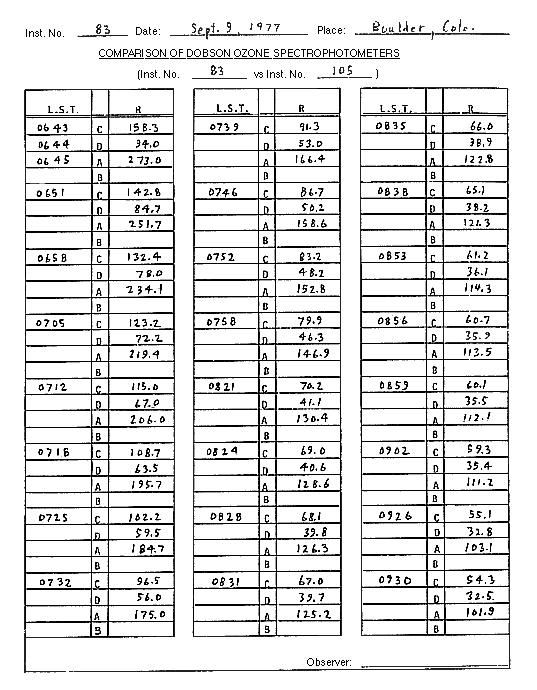
A computer program is available at the NOAA, Air Resources Laboratory, Boulder-, Colorado, for detailed processing and analysis of spectrophotometer intercomparison data. To standardize calibration procedures, computer input data are recorded on forms such as those shown on the following three pages. For proper recording of the observational data, comparison observations must be made "on-the-minute", with each measurement beginning 10 seconds before the minute and ending 10 seconds after the minute.


2. Calibration of Spectrophotometers by Special Direct Sun Observations
To check whether the N tables used in reducing routine total ozone data are accurate (i.e., that the spectrophotometer is calibrated correctly on an absolute scale), special direct sun observations are made according to instructions given in Section 6.4.1. Pairs of observations are required during mornings and/or afternoons when mu is in the range 1.15 to 1.5 and again when mu is between 2.5 and 3. The measurements consist of the usual type of AD-DSGQP and CD-DSGQP observations made especially carefully on days when the total ozone amount remains constant or nearly so. The sky on these days must be relatively free from dust, smoke, or haze particles. Three sets of independent measurements should be made in succession on each of the two double pair wavelengths whenever the special measurements are made.
Corrections to the N tables can only be determined by assuming that there is no regular diurnal variation in total ozone amount (X) about noon. Consider first observations on A and D wavelengths. Let deltaXAD and deltacos Z be the difference in XAD and cos Z between two observations on the same morning (or afternoon) taken on high and low sun, defining deltaXAD positive when the value nearer noon is the greater. delta cos Z is always taken to be positive. The average values deltaXAD and delta cos Z are then formed over a suitably large number of days, enabling one to calculate
              ave(deltaXAD)
deltaXAD = -------------------
            ave(delta cos Z)
The size of this quantity is an index that may be used to correct the values of NA - ND and XAD. To correct the NA - ND values, decrease them by an amount
taking into account the sign of deltaXAD. To correct the XAD ozone values already calculated, reduce them by an amount deltaXAD cos Z.
In the full analysis, XA, XC, XD, and XCD are examined in the same way. For example, to correct N values given by the N table, decrease them an amount
Note that it is possible to calculate XA, XC, and XD values from XAD and XCD observations since, whenever a measurement such as an ADADA is made, the mean observing time for that observation is the same as for measurements on the three A wavelengths alone, or for the two D wavelengths measurements. In calculating XA, XC, and XD, the scattering coefficients (delta - delta') are commonly assumed to be equal to zero if observations are made where the atmosphere is very clear.
An example of an analysis of data for A wavelengths is given below.
     Inst. No. 72              A-wavelength pair        Sterling, Va.
                                                        June 16, 1962

             1         2        3        4      1 - 3      2 - 4
               Near noon         A.M. or P.M.
  Date       XA      Cos Z      XA      Cos Z   deltaXA    deltaCos Z
------------------------------------------------------------------------
4/10/62     .339     .8568     .366     .3485   -0.027     .5083
4/25/62     .315     .8349     .337     .2824   -0.022     .5525
4/26/62     .323     .8101     .344     .2945   -0.021     .5156
5/05/62     .340     .8486     .362     .3095   -0.022     .5391
5/25/52     .313     .7974     .338     .3234   -0.025     .4740

                                       ---------------------------------
                                       Sum      -0.117    2.5895
                                       ---------------------------------
                                       Mean           deltaXA = -0.023
                                                   deltaCos Z = 0.5179

deltaXA = -0.0234/0.5179 = -0.0452


... Decrease NA values by 1.762 * -0.0452 = -0.0796, or

    Increase NA values by +0.0796.
Since values given in N tables are actually 1O0N values, the result is the following. Increase each value in NA table by 7.96 ~ 8.0 units.
For an accurate check of the spectrophotometer calibration, considerably more data should generally be used than that shown in the above example in order that weather-induced day-to-day changes in ozone cancel for the data set. One method is to use selected data from an entire year of observations.
3.0 Calibrating a Spectrophotometer by Standard Lamps
It is possible to assign a fairly accurate absolute calibration to a spectrophotometer that has been reliably calibrated on a relative scale, by means of standard lamps. This is done by performing routine standard lamp tests on a calibrated spectrophotometer, such as the Primary Standard Instrument No. 83, and converting the spectrophotometer R-dial readings at the A, B, C, and D wavelengths to NA, NB, NC, and ND values, using the calibrated spectrophotometer's N tables. This procedure establishes a set of N values for the lamp.
To calibrate a spectrophotometer having G tables only, or inaccurate N tables, the procedure is to perform standard lamp tests with the calibrated lamp on the instrument, and to adjust the instrument's N or G tables by suitable constants so that the corrected tables yield correct lamp N values. Ideally, calibration transfers with lamps should be done using at least three lamps.
This method of calibrating a Dobson spectrophotometer on an absolute scale should be regarded as approximate since, for satisfactory results to be attained, it is necessary that the spectrophotometer be properly aligned optically and that its optical wedge be highly accurately calibrated. Tests performed at the NOAA Air Resources Laboratory in Boulder, Colorado, have indicated that it is possible to calibrate spectrophotometers correctly with standard lamps on an absolute scale on the average to within about ±0.5% and ±1.0% for observations on AD and CD wavelengths, respectively. Maximum calibration errors generally do not exceed twice these values.
Return to Table of Contents
Forward to Appendix E. Determination of Corrections to N Tables from Standard Lamp Test Data