
OMI/OMPS Ozone Time Series Data
This tool allows OMI or OPMS daily ozone values to be retrieved as a time series for a specific latitude and longitude coordinate and date range. The resulting dataset can be generated in either CSV-text or an XY-Plot in PNG format. For text-based datasets, missing data values can be filtered from the text dataset by setting Include Missing Data to NO. The ozone values returned include the value from the nearest satellite lat/lon data point, and an interpolated value. OMI data are gridded at 0.25 degrees, OMPS data are gridded at 1.0 degrees. Data are rendered in a new browser window or tab (browser setting specific).
OMI Satellite Level 3e daily averaged ozone data gridded at 0.25 x 0.25 degrees are being obtained from the EarthDATA GES DISC website. Availability of the OMI data cover October of 2004 to present, and have about two days latency. NetCDF files containing Total Column Ozone are an alternate source for OMI O3 data.
OMPS Satellite daily averaged ozone data gridded at 1.0 x 1.0 degrees have been obtained from the EarthDATA GES DISC OPMS website. Availability of the OMPS data cover Jan 26, 2012 to present, and have about two days latency.
Example Text Format Output
# Satellite: OMI # Latitude: 40.125 # Longitude: -105.238 # Sat Lat: 40.125 # Sat Lon: 105.125 # Lat Diff: 0.000 # Lon Diff: 0.113 # Interp X1,X2,Y1,Y2: 105.125, 105.375, 39.875, 40.125 # StartDate: 2014-12-20 # EndDate: 2015-01-10 # All Data: False # Entry Cnt: 14 # yyyy, MM, dd, DDD, O3_Nearest, O3_Interpolated, InterpolPos 2014, 12, 21, 355, 313.000, 313.000, Y 2014, 12, 22, 356, 337.000, 338.808, Y 2014, 12, 23, 357, 315.000, 315.000, Y 2014, 12, 24, 358, 282.000, 282.000, Y 2014, 12, 26, 360, 344.000, 344.904, Y 2014, 12, 28, 362, 345.000, 345.452, Y 2014, 12, 30, 364, 336.000, 336.904, Y 2014, 12, 31, 365, 291.000, 291.904, Y 2015, 01, 02, 002, 269.000, 269.452, Y 2015, 01, 04, 004, 310.000, 310.000, Y 2015, 01, 06, 006, 271.000, 271.000, Y 2015, 01, 07, 007, 256.000, 253.740, Y 2015, 01, 08, 008, 265.000, 265.000, Y 2015, 01, 09, 009, 271.000, 271.000, Y |
Description: Header Information summerizes the user's supplied parameters, and the total count of data points in the returned dataset.
|
Example showing values used in Ozone Interpolation
# Satellite: OMI # Latitude: 40.125 # Longitude: 105.238 # Sat Lat: 40.125 # Sat Lon: 105.125 # Lat Diff: 0.000 # Lon Diff: 0.113 # Interp X1,X2,Y1,Y2: 105.125, 105.375, 39.875, 40.125 # StartDate: 2014-12-20 # EndDate: 2015-01-10 # All Data: False # Entry Cnt: 14 # yyyy, MM, dd, DDD, O3_Nearest, O3_Interpolated, InterpolPos, Q11, Q21, Q12, Q22, Quad 2014, 12, 21, 355, 313.000, 313.000, Y, 312.0, 312.0, 313.0, 313.0, 4 2014, 12, 22, 356, 337.000, 338.808, Y, 349.0, 357.0, 337.0, 341.0, 4 2014, 12, 23, 357, 315.000, 315.000, Y, 315.0, 315.0, 315.0, 315.0, 4 2014, 12, 24, 358, 282.000, 282.000, Y, 283.0, 280.0, 282.0, 282.0, 4 2014, 12, 26, 360, 344.000, 344.904, Y, 346.0, 346.0, 344.0, 346.0, 4 2014, 12, 28, 362, 345.000, 345.452, Y, 345.0, 345.0, 345.0, 346.0, 4 2014, 12, 30, 364, 336.000, 336.904, Y, 335.0, 339.0, 336.0, 338.0, 4 2014, 12, 31, 365, 291.000, 291.904, Y, 290.0, 289.0, 291.0, 293.0, 4 2015, 01, 02, 002, 269.000, 269.452, Y, 271.0, 262.0, 269.0, 270.0, 4 2015, 01, 04, 004, 310.000, 310.000, Y, 312.0, 312.0, 310.0, 310.0, 4 2015, 01, 06, 006, 271.000, 271.000, Y, 270.0, 270.0, 271.0, 271.0, 4 2015, 01, 07, 007, 256.000, 253.740, Y, 253.0, 253.0, 256.0, 251.0, 4 2015, 01, 08, 008, 265.000, 265.000, Y, 266.0, 266.0, 265.0, 265.0, 4 2015, 01, 09, 009, 271.000, 271.000, Y, 272.0, 271.0, 271.0, 271.0, 4 |
Q11=Lower Left
Q21=Lower Right
Q12=Upper Left
Q22=Upper Right
Quad = Quadrant Location Number
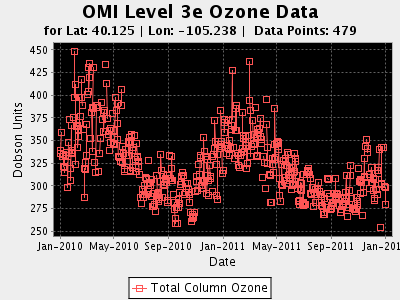
Example Graphical Format Output
|
Description:
User definable parameters include:
|
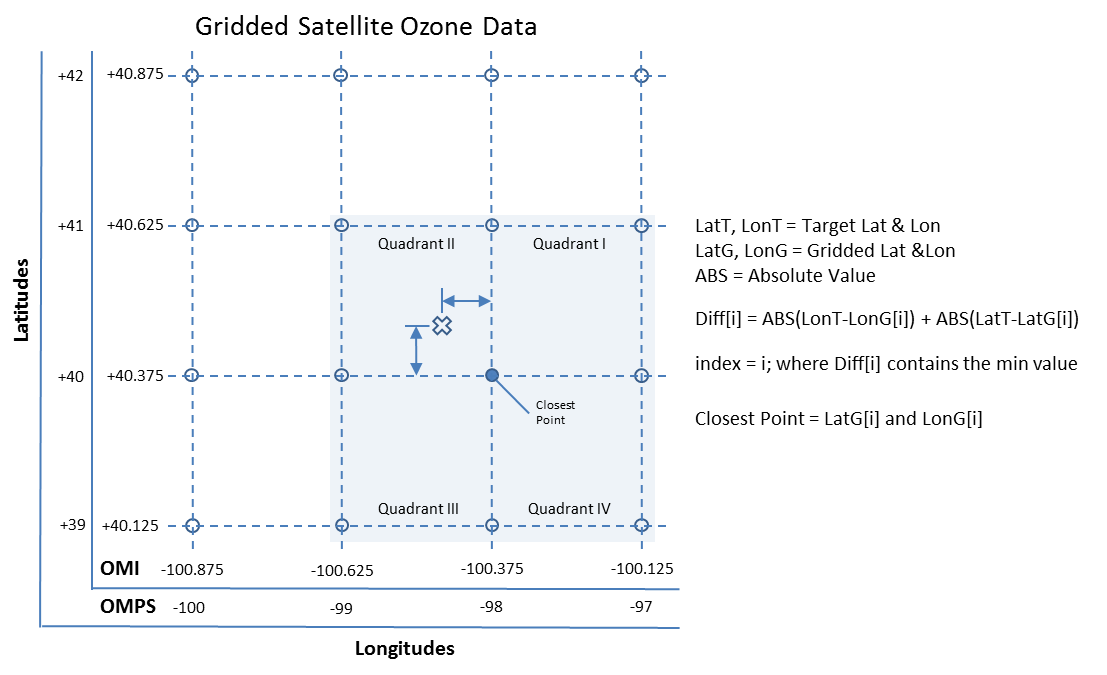
Nearest Point Calculation
Satellite data are read from files into indexed Vectors for latitude, longitude, and O3 values. The index of the closest lat/lon is determined by comparing the sum of the difference of absolute values of tagetLat-SatLat and targetLon-SatLon. Once the index is known then the values are extracted from the Vectors. The Figure below illustrates the closest point algorithm.
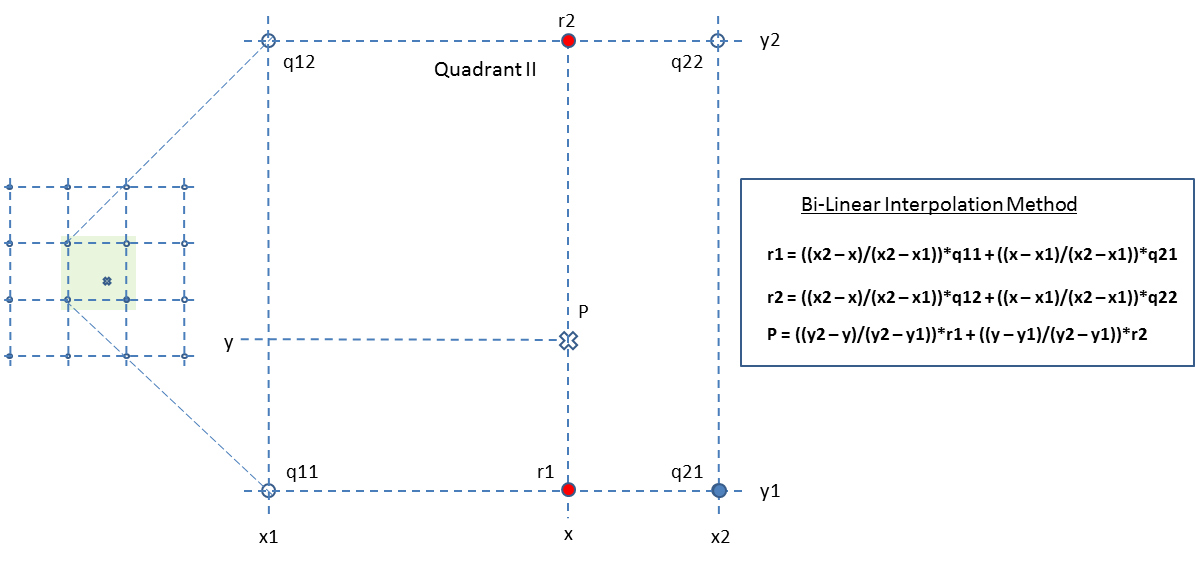
Bi-linear Interpolation Algorithm
Interpolated values of ozone at the target lat/lon are calculated with a Bi-linear Interpolation algorithm that first determines what quadrant the target lat/lon fall with reference to the closest point, then applies the interpolation to the four ozone values of the quadrant (q11, q21, q12, q22) as shown in the Figure below.