

|
|
|
Funded by the National Oceanic and Atmospheric Administration's
Environmental Services Data and Information Management Program (
ESDIM).
 |
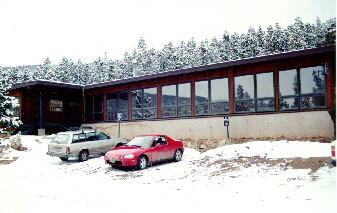 |
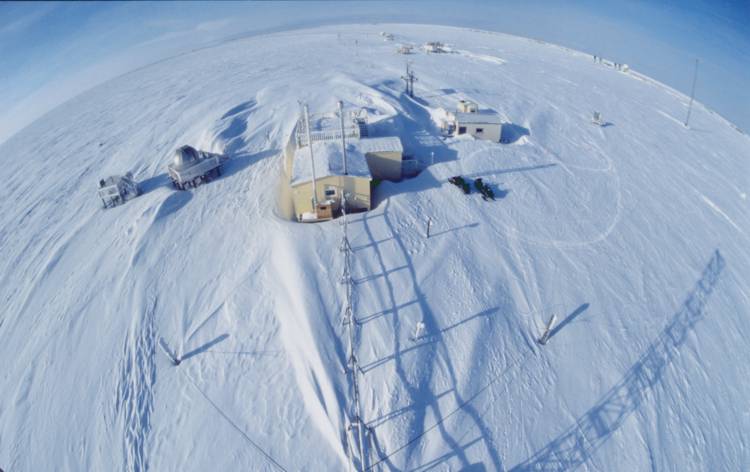
| Barrow, Alaska | Niwot Ridge, Colorado |
 |
 |
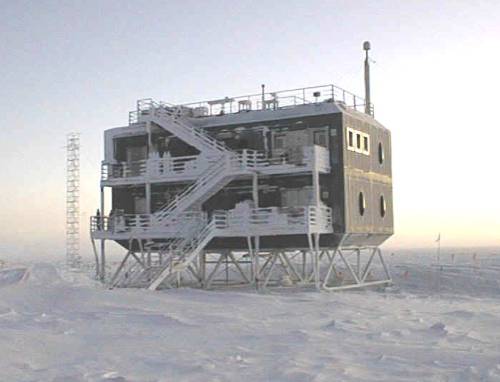 |
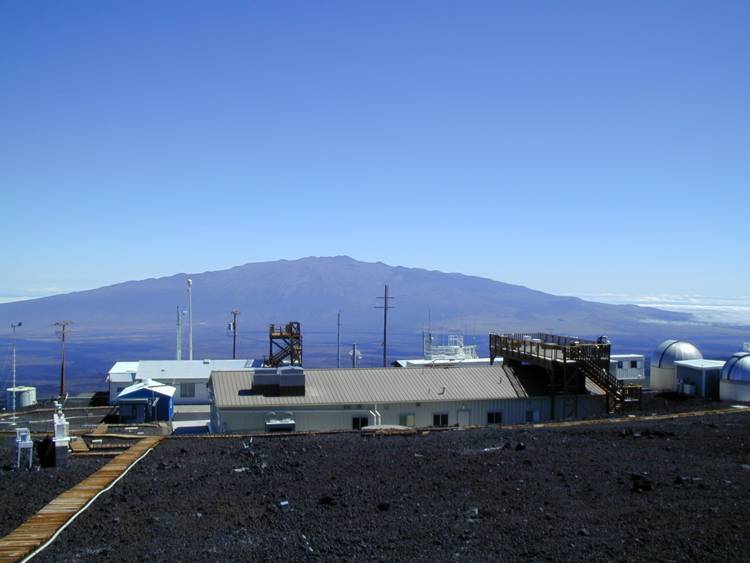
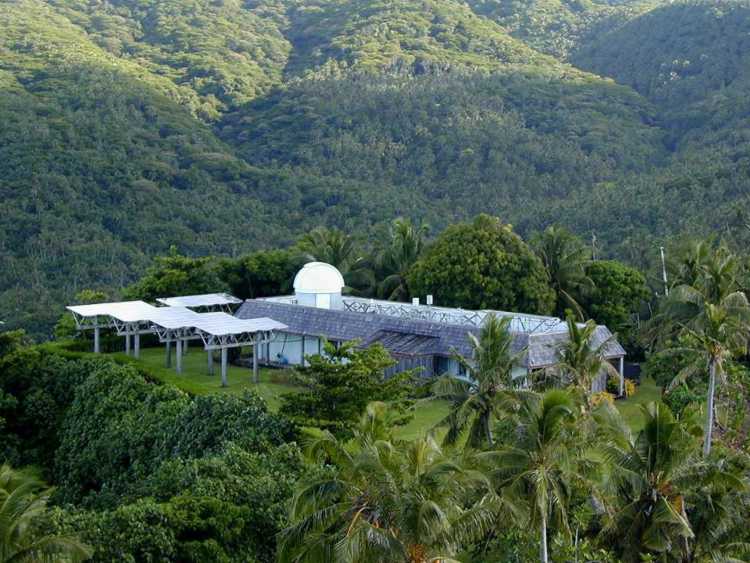
| Mauna Loa, Hawaii | Cape Matatula, American Samoa | South Pole, Antarctica |
| Title Page: | Rescue of Climatic Change Data for Trace Gases in the Atmosphere and Ocean from the RITS Program |
The Climate Monitoring and Diagnostics Laboratory
In 1985, the Radiatively Important Trace Species (RITS) program was launched
to provide concurrent in situ monitoring
of several of the same ozone-depleting chemicals measured in the HATS
flask program. Gas chromatographs with
electron capture detectors (ECDs) were installed at five sites over a period of five
years for the purpose of measuring nitrous oxide (N2O), the
chlorofluorocarbons
Since the establishment of the flask and in situ monitoring programs, many new
compounds have been added to the list of those measured and analyzed by the HATS
group. These include several hydrofluorocarbons
Between June, 1998 and October 2000, CATS systems were installed at each of the five
field sites occupied by RITS sytems. Data continuity was insured by allowing the RITS systems
to run for a period of several months overlap with the new CATS systems until data from
the latter showed equal or better precision. The last of the RITS systems, at Niwot Ridge,
was shut down in August of 2001. Click here
for a chronicle of RITS/CATS field installations.
Over the 15 year history of the RITS program many hardware changes and modifications to sampling protocols has given an evolutionary aspect to the naming conventions and storage formats of chromatogram files and to the structure of processed data files. An effort is now underway to bring the RITS data into a standard form for inclusion in the NOAA data center archives. One of the goals of this effort is to produce a comprehensive and finalized set of atmospheric mixing ratios for the five compounds that the RITS system was originally designed to measure. In addition, there may be considerable useful information concerning newer compounds of interest that has yet to be extracted from the RITS raw data. In particular, small SF6 peaks have been evident in the third (C) channel of the RITS system for several years. Thus, the second major goal of this archiving effort is to rebuild the RITS database in an easily expandable form that can readily accomodate future analyses of additional compounds.
A RITS system in its fullest form consisted of 2 GCs and 3 separation columns
(channels), each loaded with a unique packing material for the measurement of
N2O, CFC-12, CFC-11, CH3CCl3, and CCl4, with
multi-channel redundancy for N2O and CFC-11. N2 was the carrier
gas used on the chlorocarbon solvent (B) channel, while the two N2O channels
(A and C) used a 5% mixture of CH4 in Argon (called "P5") as the carrier gas.
The RITS system is summarized by channel in
| RITS Channel |
Gas Chromatograph |
Carrier Gas |
Column Packing Material |
Detector | Measureable Compounds |
|---|---|---|---|---|---|
| A | Hewlett-Packard 5890 | P5 | Porasil B | Electron Capture |
N2O, CFC-12, CFC-11 |
| B | Hewlett-Packard 5890 | N2 | OV-101 | Electron Capture |
CFC-11, CFC-113, CH3CCl3, CCl4 |
| C | Shimadzu | P5 | Porapak Q | Electron Capture |
N2O, SF6 |
A 3-channel RITS system sampling once every half hour could produce up to 1008 chromatograms every week. These chromatograms were recorded on site using an integer-differencing scheme and a proprietary binary format dictated by the Hewlett-Packard machines and BASIC language software that were chosen in the mid-1980s for recording and manipulating the data. A variety of chromatogram file structures and naming conventions were utilized in dealing with hardware and/or software changes at the field sites. The last time the RITS program was fully operational was early in 1999. At that time ~4700 chromatograms per week were arriving in Boulder for processing.
Transport of chromatograms to Boulder was normally accomplished on floppy disk delivered via US mail, though in later years transport was often accomplished over the internet. Once in Boulder, the chromatograms were transferred to hard disk for processing and later stored on a total of 17 magneto optical disks with secondary backup to 48 DC600 tape cartridges and several dozen zip archives maintained on other hard drives. The entire store of raw RITS data consists of ~2.5 million chromatograms from the five field sites combined.
Chromatogram processing was most often performed in Boulder on a Hewlett-Packard workstation using modified BASIC language software acquired during the early stages of the RITS program. The sole exception to this rule was during the years 1988-1993 when, because of logistical constraints, South Pole chromatograms were processed on site. The outputs generated during processing (i.e. the chromatographic peak areas and heights) were assembled in record-oriented binary format database files for later retrieval during the computation of atmospheric concentrations. Each of these database files was structured in accordance with one of several multi-sample sequencing protocols that changed over the years. The areas/heights database is maintained on HP-UNIX workstations and backed up on a separate UNIX server as are the calibration mixing ratios for every calibration tank used in the RITS program.
Apart from issues related to the nonuniformity of data storage formats, it was found that reduction-stage data loss had occurred in response to several different chromatogram recording and processing errors. These are detailed at the summary links listed below:
Primary Reasons for Data Loss During Chromatogram ProcessingMost of these various types of data loss require the reprocessing of chromatograms to correct. (Up to now the affected data have tended either to drop out or to be excluded as outliers during the computation of mixing ratios.) In other cases, reprocessing of chromatograms would not help without first restructuring the database so that each sample injection is uniquely timestamped (see, for example, the fourth bulleted item above). Restructuring is also required to make room for the addition of new peaks (e.g. SF6) that have yet to be analyzed.
The first step in the rescue effort involved standardizing the raw data and transferring it to a modern storage media (CDROM). Prior to permanent storage on CDROM, efforts were made to recheck the chromatograms for consistency problems and, if possible, resolve those detected.
Chromatograms were organized by station into 3-month blocks and passed through a program that checked for timestamp and channel identifier discrepancies between the internal (file header) and external (filename) descriptors. Each chromatogram was read by the program using one of several input routines determined by the file-naming convention used. The chromatograms were then rewritten using a single output routine and naming convention consistent with the last of the chromatogram file formats and naming conventions used during the RITS program. Inconsistent or corrupt chromatograms were detected and diverted to a separate output directory as were any files that required a filename already claimed (as might occur during a "time fold"). Standard error output messages were used to pinpoint precisely where the program choked on the offending data file in order to diagnose and, if possible, remedy the problem. All problematic chromatograms remedied were subsequently reprocessed into the areas/heights database.
Sample-type labeling errors were detected by plotting ratios of processed areas and/or heights for nearby environmental (AIR) and calibration (CAL) sample injections. Suspicious-looking step jumps in the time series of ratios were very often an indicator that the corresponding chromatograms had been incorrectly labeled according to sample type. Many such segments of data were detected, and the areas/heights database was updated by reprocessing the corrected chromatograms.
The final step prior to burning the chromatograms to CDROM, involved passing them through an inventory program. The inventory files, one for each station, consisted of 1 record for every 30-minute block of time from the beginning of the first year to the end of the last year of RITS system operation at the station specified. (Note: 30 minutes was the fastest sample injection rate used by any RITS system.) The program would open each chromatogram and compute an inventory record number from the timestamp. If that record was unused, the program would update it with the channel identifier, sample type and the minute of the half hour (0-29) that, along with the record number, completely specified the timestamp of the chromatogram. If the record had already been claimed by a previously scanned chromatogram, the program would ensure that the current chromatogram posessed an identical timestamp and sample type, and a unique channel identifier. If all of these tests were met, the program would update the inventory record with the addition of the new channel. If any of these tests failed an error message was generated. Since every chromatogram produced by a single sample injection (1 chromatogram for each of up to 3 channels) should have identical timestamps and sample-type labels, the inventory program effectively detected cross-channel consistency problems with chromatograms that went undetected by the other screening procedures. After these chromatograms were corrected, reprocessed, and reinventoried, the entire 3-month block of chromatograms was deemed ready for transfer to CDROM.
The saving of chromatograms took far more time than anticipated due to a variety of complications. The number of file naming and storage conventions that resulted over the years from changes in RITS system hardware and software was a significant factor. More important by far were the difficulties encountered with the primary storage media, the magneto optical disk, which suffered throughout much of the year 1993 from an attenuated laser. As a result, a very high number of read errors occurred while retrieving chromatograms from the disk storing the data recorded that year. Several repairs were made to the disk's filesystem before it became irrevocably corrupted. This forced the retrieval of chromatograms from the secondary storage media, DC600 tape. The recovery was painstakingly slow by comparison and exacerbated by fact that these backups were made from fresh data floppies shortly after their arrival in Boulder and prior to any efforts made at quality control. Much additional programming was required to cross-check these chromatograms with the areas/heights database in search of sections where sample-type labeling and timestamp corrections had formerly been applied. Furthermore, it was discoverd that one week's worth of data contained on a floppy disk from Mauna Loa had been overlooked during tape backup. These chromatograms were rescued by performing a block-by-block extraction and reassembly of the files stored on the corrupted optical disk. Since each chromatogram contains an internal timestamp and channel identifier but no internal station identifier, all reassembled files within the lost time period were given filenames with a bogus station identifier. These were then compared with the chromatograms for the other three stations that were retrieved from tape (there were no South Pole chromatograms from the year 1993). Those for which no match was found were assumed to be the missing chromatograms from Mauna Loa, and a visual inspection of their plotted data bore this out.
Database RestructuringThe original areas/heights database has been restructured for two reasons: 1) It was unable to accomodate analyses of any new compounds beyond those for which it was originally designed; 2) It was inherently vulnerable to an infrequent and widely dispersed form of avoidable data loss.
The first problem was solved by breaking the database up by compound. For any given station, the processed data for each chromatographic peak can now be stored in its own, dedicated, processed data file. Analyses of new peaks can be performed simply by building new files for those peaks. Nothing can be done to inadvertently alter the data already extracted from the original peaks since these data can be isolated in their own files.
The second problem was solved by building the new database in a way that allows each sample injection to be individually timestamped. This also has the effect of rendering the new database compatible with all file-type variations found among the original database files. The new files are structured in a fashion nearly identical to that used for the chromatogram inventory files. Timestamps have been provided for all sample injections by initializing the new database files with the chromatogram inventories. An algorithm that was inversely designed in close coordination with the chromatogram processing algorithm is used to pull data from the original database and correctly match it with its inventoried chromatogram. The program, which also compiles site histories for the calibration tanks used, has been thoroughly tested and, so far, has been found to perform flawlessly.
Several problems with some of the original database files from the earlier years of the RITS program required fixing before their data could be transfered to the restructured files. These problems reflected changes that were made as the RITS program evolved. The chromatogram inventory was used to correct a data record timestamping anomaly found in four of the files. An anomalous peak storage sequence found in four other files was corrected. Finally, the binary structure of the earliest database files from the RITS program (those from the year 1986) required decoding and conversion to a more familiar structure. All of these changes were necessary to achieve full campatability with existing software routines across the entire spectrum of original database files.
In addition, the original database files associated with measurements made at South Pole during the years 1988-1991 were rebuilt. Chromatograms produced at South Pole during this time were processed on site and only the peak analysis outputs were saved in the form of numerous ascii files stored on several dozen 5 1/4 inch floppies. The original database files constructed from these floppies were plagued with problems of data loss due to inconsistent scaling, file-type incompatibilities with the changing sampling protocol, unnecessary floating point truncation errors in the timestamps, and sample-type labeling errors stemming from the fact that the sample type could only be inferred from knowledge of the sampling sequence and differences in the concentration of reference compounds between the two calibration tanks. Rebuilding these files was a labor-intensive and time-consuming effort that significantly augmented and improved the South Pole database covering these early years.
One task remains to be performed before the new database is fully implemented. An effort is currently underway to locate and reprocess any series of chromatograms defining measureable peaks that the processing software has misidentified or missed altogether. Since peak retention times have not been recorded into the areas/heights database, a graphical method has been programmed for the purpose of accomplishing this task. After reprocessing these chromatograms, the original areas/heights database, which has been continually updated and improved throughout this entire process, will essentially be in its best achievable form, and its data can then be cleanly transferred into the restructured database.
Atmospheric ConcentrationsWhen the search for misidentified chromatographic peaks has concluded, and the restructured database has been fully implemented, the computation of atmospheric concentrations for the compounds measured can proceed from both the original and the restructured areas/heights databases. There should be very little difference between the two sources with the following exceptions: 1) the new database will have a better-defined time description of the data; and 2) prior to the computation of atmospheric concentrations, the new database will be scanned to find and process inventoried chromatograms that have retained the missing data flag assigned to them during initialization (as might occur due to structural problems associated with the original database). Moreover, future analyses of new compounds, such as SF6, will be facilitated using the new database. The chromatogram processing software has already been modified to output to either database. Routines for computing atmospheric concentrations from the original areas/heights database are likewise already in place. Routines for performing this task using the new database remain under developement.
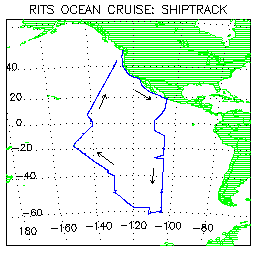
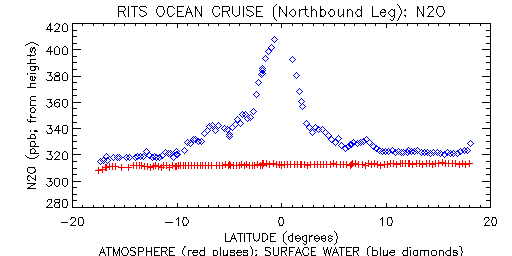
The RITS Ocean Cruise of 1989The peak analysis outputs of chromatograms measured from air and surface water equilibrator samples collected during the RITS Discovery Pacific Ocean Cruise of 1989 have been used to compute atmospheric and surface water concentrations of the following compounds: N2O, CFC-11, CFC-113, CH3CCl3, and CCl4. Shown below are two plots: Left) a plot of the shiptrack; Right) a plot of atmospheric and surface water concentrations of N2O measured during the ship's northbound equatorial crossing. The ship originated in Seattle and initially travelled southward along the North American coastline with ports in San Diego and Manzanillo. From there it travelled due South over open water along the 105th meridian to 61o S latitude before returning northward to Seattle along a more westward route. Two ports during this open water segement were at Easter Island and Tahiti. The N2O plot shows the relative abundance of N2O in the warmer surface waters near the equator. The concentrations computed to date remain preliminary.
 |
 |
Remaining Tasks:
Last modified August 2002 by David Nance.
 |
|