
About the GGGRN
What is the Global Greenhouse Gas Reference Network?
The Global Greenhouse Gas Reference Network measures the atmospheric distribution and trends of the three main long-term drivers of climate change, carbon dioxide (CO2), methane (CH4), and nitrous oxide (N2O), as well as carbon monoxide (CO) which is an important indicator of air pollution.
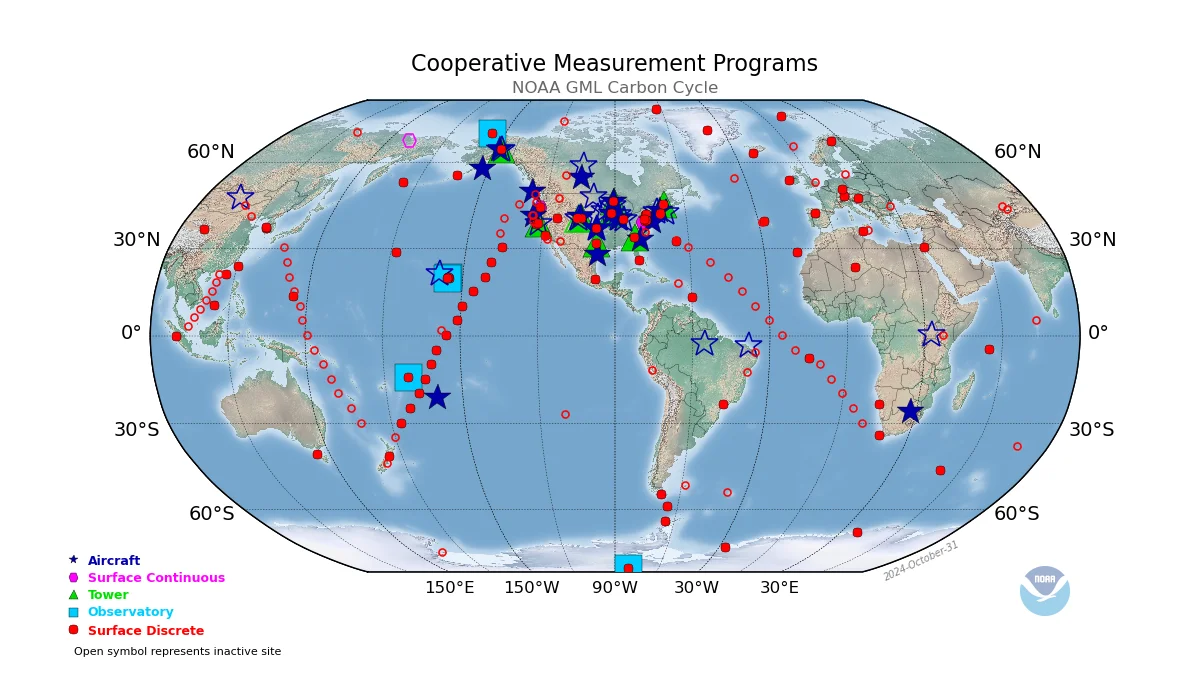
The Reference Network is a part of NOAA's Global Monitoring Laboratory in Boulder, Colorado. The measurement programs include:
- Measurements at the NOAA/GML Atmospheric Baseline Observatories and multiple tall towers in the United States
- Air samples collected by volunteers at more than 50 sites around the world
- Air samples collected regularly from small aircraft mostly in North America
- Vertical profiles using balloons and the Aircore sampling system
All measurements of up to ~55 trace gases are subject to stringent quality control procedures, and are directly traceable to internationally accepted calibration scales where possible. In fact, NOAA’s Global Greenhouse Gas Reference Network maintains the World Meteorological Organization international calibration scales for CO2, CH4, CO, N2O, and SF6 in air. WMO has a Mutual Recognition Agreement with the BIPM, which represents the National Metrology Institutes.
View map and listing of the reference network sites...
What are some of the results from the network?
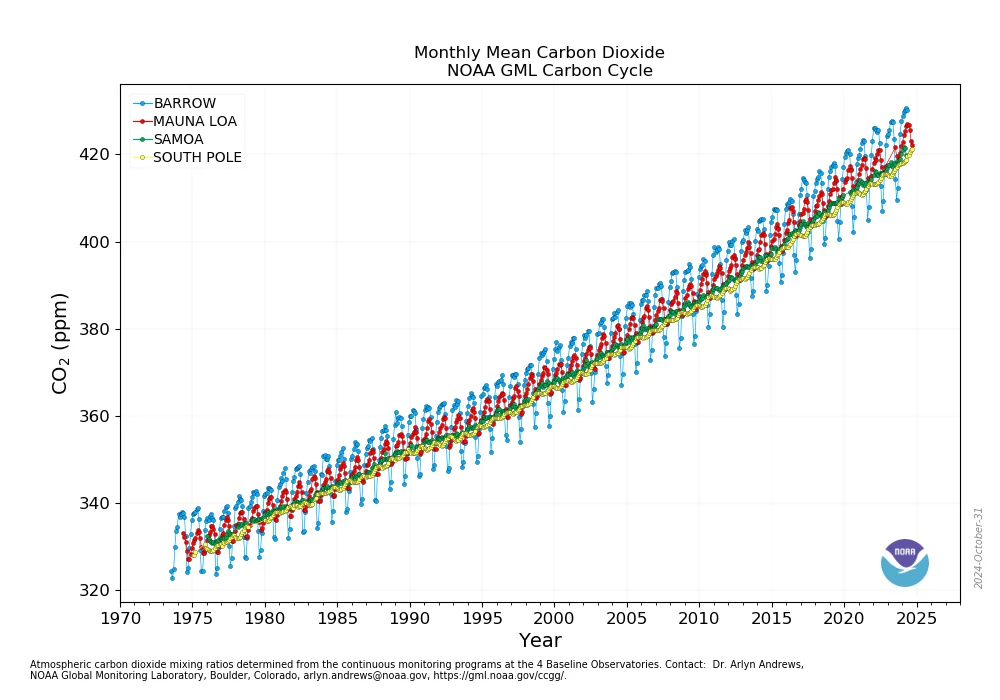
Monthly average carbon dioxide data for the four baseline observatories are plotted in Figure 1. The observed increase, due primarily to CO2 emissions from fossil fuel burning, is similar at all four remote locations. CO2 remains in the atmosphere for a very long time, and emissions from any location mix throughout the atmosphere in about one year. The annual oscillations at the two northern hemisphere sites (Barrow, Alaska and Mauna Loa, Hawaii) are due to the seasonal imbalance between the photosynthesis and respiration of plants on land. During the summer photosynthesis exceeds respiration and CO2 is removed from the atmosphere, whereas outside the growing season respiration exceeds photosynthesis and CO2 is returned to the atmosphere. The seasonal cycle is strongest in the northern hemisphere because of the presence of the continents. The difference between Mauna Loa and the South Pole has increased over time as the global rate of fossil fuel burning, most of which takes place in the northern hemisphere, has accelerated.
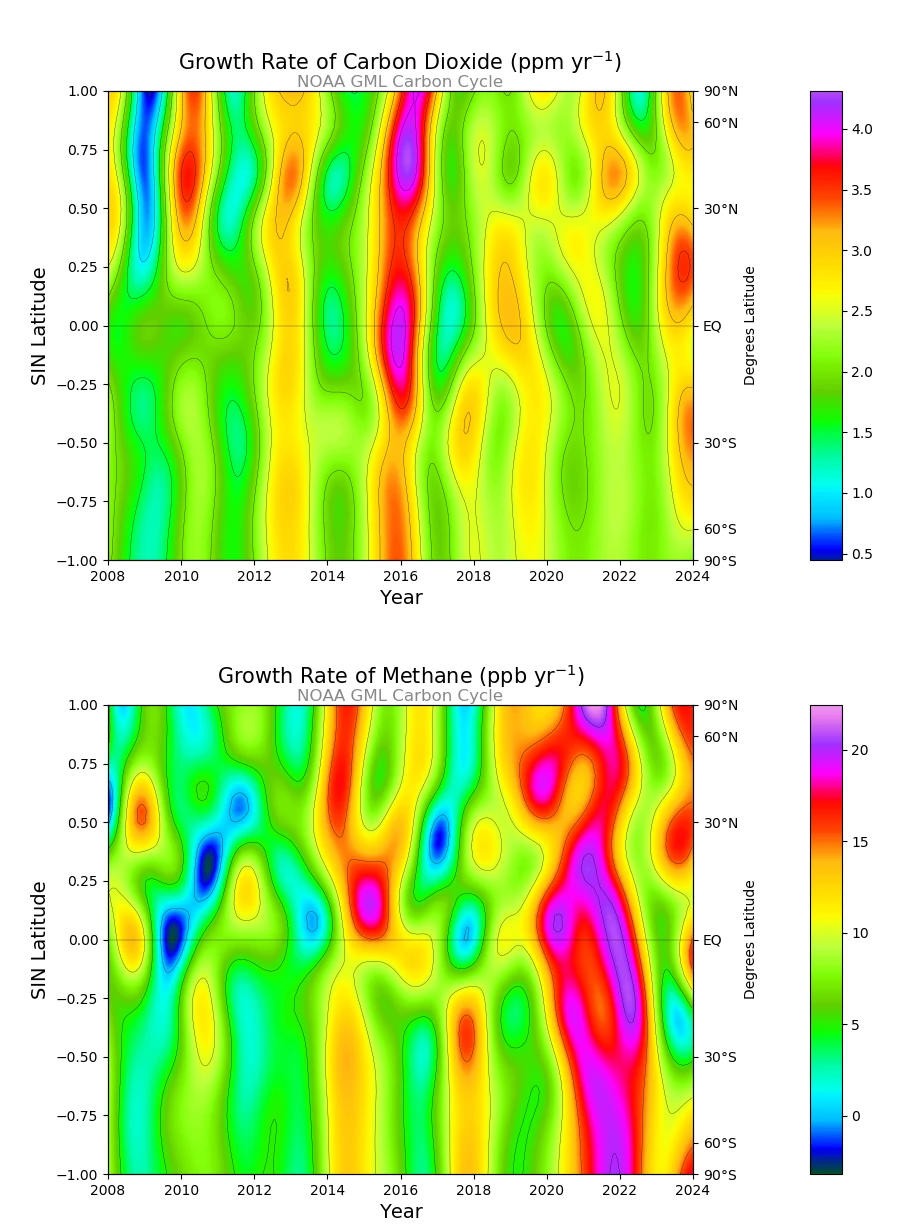
A quantity of keen interest for each trace gas is the global-average rate of increase (“growth rate”), after removal of the seasonal cycle. The CO2 and CH4 growth rates are plotted as a function of time and latitude in Figure 2. The warmer colors (yellow, orange) indicate periods of higher-than average growth rate and the cooler colors (blue, purple) indicate periods of lower growth rate. The CO2 growth rate growth rate varies from year to year with a trend toward higher growth rates since 2000. The CH4 growth rate slowed during the 1990s and early 2000s, but has accelerated again during 2007-2012.
The annual variations of the CO2 growth rate are not due to variations in fossil fuel emissions. Figure 3 shows the measured annual atmospheric increase of CO2 compared to the reported annual fossil fuel emissions. The ups and downs in the atmospheric increase are due to variations in the exchange of CO2 between the atmosphere, oceans, and land ecosystems. They are primarily due to small annual fluctuations of temperature and precipitation affecting photosynthesis and respiration on land. It is very important to know that the added CO2 does not disappear, but, as long as atmospheric CO2 keeps rising, a portion of it transfers each year from the atmosphere to the oceans and to plants on land. Since CO2 is an acid, the transfer to the oceans causes the surface oceans to acidify.

The variations in the CH4 growth rate (Figure 2) are also related to climate anomalies. Analysis of the NOAA data suggests that the recent increase is related to greater-than-average precipitation in tropical regions resulting in above average emissions from tropical wetlands. Understanding the processes that cause the CO2 and CH4 growth rate variations and long-term trends is crucial to enable governments and society in general to make informed decisions on energy policy and on mitigating climate change. Long-term projections of CO2, CH4, and N2O depend on future emissions trajectories, which include land use, and on climate feedbacks as they are incorporated into climate-ecosystem models. An example of the latter would be Arctic warming producing CH4 and CO2 emissions from melting permafrost, out of our control. For the models to be credible, it is necessary (but not sufficient) that they reproduce the recent past as we have observed it.
Where is the data from the network?
The carefully calibrated and documented measurements of the Global Greenhouse Gas Reference Network are freely available. They serve as a comparison with measurements made by many other international laboratories, and with regional studies. They are widely used in studies inferring space-time patterns of emissions and removals of greenhouse gases that are optimally consistent with the atmospheric observations. They serve as an early warning for climate “surprises”. The calibrated observations are also indispensable for the ongoing evaluation of remote sensing technologies: Greenhouse gas abundances derived from optical absorption measurements from space can never be calibrated because one cannot control the abundance of the gases being estimated, nor can we control potential interfering factors in the optical path. Given the requirement that for remote sensing data to be useful any systematic biases need to be kept to an extremely low level, ongoing comparisons with calibrated measurements are a must.
Data from the Reference Network as well as data from over 400 agencies worldwide are available as ObsPack products.ObsPack products are designed to bring together direct atmospheric greenhouse gas measurements derived from multiple national or university laboratories, and package and distribute them in a set of self-documenting files. ObsPack products include a set of prepared data sets and metadata, a summary of included data sets, and an e-mail address list of all data providers.