
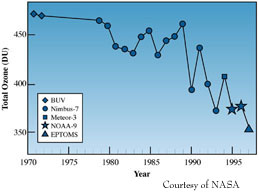
In the last few decades, particularly in the 1990s, anthropogenic influences on the natural ozone layer have resulted in severe ozone depletion in polar regions. Indeed, as seen in the two figures below, during March 1997, stratospheric ozone in the Arctic reached all time lows with losses due to halogen- related chemistry rivaling the Antarctic losses observed since the infamous 'ozone hole' was discovered in 1985. Three- dimensional, coupled physical- chemical models indicate that depletion of stratospheric ozone in the Arctic will increase in the future as climate change cools the stratosphere and stabilizes the polar vortex during the period when stratospheric chlorine and bromine from human- made halogen compounds will remain high (the next 20-30 years).
Figure 1 shows March monthly average total ozone polar stereographic images for 1971 and 1972 (Nimbus-4 satellite, BUV instrument); 1979, 1980, 1990, and 1993 (Nimbus-7 satellite, TOMS instrument); 1996 (NOAA-9 satellite, SBUV/2 instrument); and 1997 (Earth Probe satellite, TOMS instrument)
High ozone values are yellow-red in color, while low total ozone values are blue-purple in color. Note the distinct differences in ozone between the earlier years and later years in the Arctic region
Unusually low values of total ozone were observed over the Arctic in the spring of 1997. During an approximately 2-week period in March 1997, the satellite-based Total Ozone Mapping Spectrometer (TOMS) instruments found that the ozone levels over a large region centered over the North Pole were as much as 40 percent below the normal amount for this time of year
SO WHY IS UV IMPORTANT IN THE ARCTIC?
- Ozone depletion has been more severe in the polar regions than elsewhere in the world
- UV radiation is accentuated in the Arctic because of multiple reflections between cloud and snow cover
- New snow can reflect as much as 90% of all the incoming UV radiation
- A thin cloud cover can cause UV rays to bounce back and forth between the snow and the clouds, increasing the UV dose in all directions
Rare and fragile life forms and the potential for excessive stratospheric ozone loss in the Arctic make the monitoring of actual variations in the biologically sensitive regions of the ultraviolet (UV) spectrum (280- 320nm) particularly important in the Alaskan Arctic. An additional threat is the combination of the effect of higher surface reflectivity, rising sun angles, and enhanced stratospheric ozone depletion with resultant higher UV levels. It is during the spring, when ozone depletion is greatest, that biological systems are most susceptible to UV damage: natural protective measures, such as pigmentation and thickening of leaves, have not had time to develop, and fish larvae are most exposed. In addition, the Bering Sea is a highly important region for biological primary production. The area has shown strong variability in biological production that, so far, is not well understood. The utility of monitoring UV, in conjunction with other current and planned studies, should help discern whether UV and photosynthetically active radiation (PAR) have a strong role in current primary production variability.
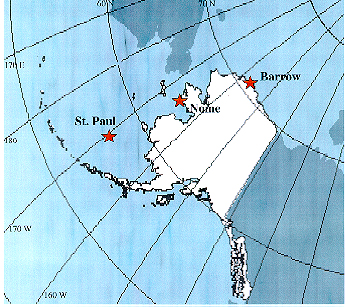
Therefore, in response to a need for improved UV measurements in the Arctic and with support from the NOAA Arctic Research Initiative (ARI), three locations in Alaska were identified for deployment of portable, yet reliable, and inexpensive instruments to measure the UV environment in Alaska. These sites are Barrow, Nome, and St. Paul Island, as identified in the following map. This effort is a collaborative activity with NOAA's Air Resources Laboratory (ARL), NOAA's National Weather Service (NWS), the University of Alaska at Fairbanks (UAF), and the University of Colorado at Boulder (CU).
WHAT ARE THE POTENTIAL EFFECTS OF INCREASED UV RADIATION IN THE ARCTIC?
- Human Health
- Terrestrial Ecosystems
- Marine Ecosystems
- Materials
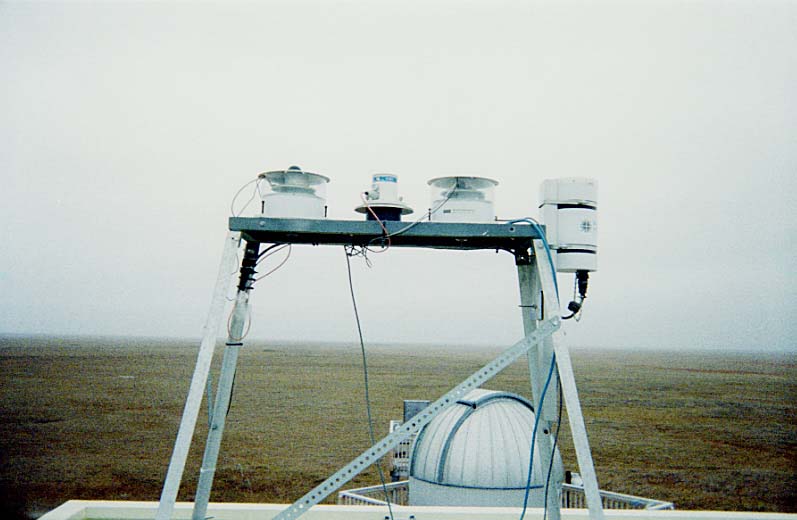
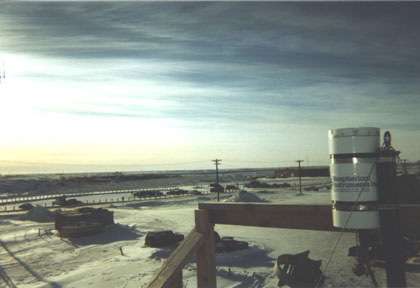
In September 1997, ground-based UV instruments were installed at the GML Barrow Observatory (lat: 71.3 N; long: 156.6 W). One instrument is a broadband UV radiometer, manufactured by Yankee Environmental Systems, Inc. (YES), which measures total irradiance over the 280-320 nm spectrum and produces an output proportional to biologically important UV radiation (UVB) or 'erythemal dose,' which describes the response of human skin to solar radiation. The other instrument, manufactured by Biospherical Instruments, Inc. (BSI), is a narrow-band (10 nm bandwidth) radiometer, which measures UV irradiance at five wavelengths (305 nm, 313 nm, 320 nm, 340 nm, and 380 nm) and is useful for applications that require better resolution than offered by broadband instruments. Both instruments are temperature controlled, and their ease in maintenance and lower cost makes them useful for deployment in harsh and remote Arctic environments. Figure 4 shows the instruments mounted on the radiation rack at the Barrow Observatory.
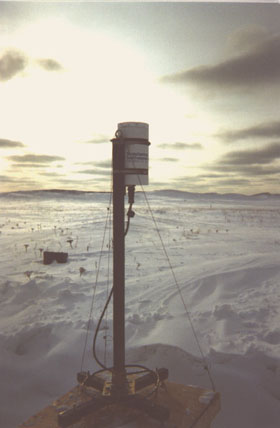
In June 1998, with an additional award by the ARI, two additional sites were established in Alaska; and a multichannel instrument, similar to the one used in Barrow, was deployed. These instruments, however, eliminated the 340 nm channel in favor of a channel that measures across the 400-700 nm spectrum (known as PAR). One instrument is located at the National Weather Service (NWS) Forecast Office in Nome (lat: 64.30 N; long: 165.26 W), which is shown in Figure 5. This instrument is mounted on the roof of the NWS building. For a peek at an article published by the Nome Nugget on March 11th, click here (259K).
The other multichannel instrument is deployed at the NWS Forecast Office on St. Paul Island (lat: 57.09 N; long: 170.13 W), which is shown in Figure 6. St. Paul Island is located in the Bering Sea and is a major breeding area for Northern Fur Seals and a variety of migratory birds. This instrument is located approximately 50 meters from the NWS office with little to no obstruction in any direction.
WHY USE A MULTI-FILTER INSTRUMENT?
- It's a compromise between a single broadband instrument and spectroradiometers
- They are lower in cost than a spectroradiometer
- They are easy to maintain and operate
- They are temperature controlled for operation in harsh Arctic regions
- They can be accurately calibrated to an established scale
- Newer filter technology promotes long-term stability (better than 2% per year)
- They provide reliable data on biologically effective uv dose rates, total ozone abundance, and effective cloud optical depth or cloud transmission
This monitoring effort at all three sites in Alaska is expected to continue indefinitely into the future. Over the next several years, GML's Arctic UV research will focus on addressing four key objectives: (1) to assess day-to- day, month-to- month, and year-to- year variability in UV irradiance in and near the Bering Sea; (2) to characterize the effects of changes in ozone on UV reaching the surface and study the relationship between ozone and UV; (3) to determine the effects of Arctic haze and other particulate matter on UV transmission in the Arctic; and (4) to provide UV data to interested users in the biological community so they can examine the effects of increasing UV on Arctic ecosystems. These objectives have been included in the U.S. National Implementation Plan for the Arctic Monitoring and Assessment Program (AMAP) and are identified in the U.S. Arctic Research Plan.
Calibrations of all UV instruments will be conducted annually when the sun sinks below the horizon for the winter. The calibration of the BSI multifilter instrument is tied to a scanning spectral radiometer used in the U.S. National Science Foundation's Polar UV Monitoring Network. This high spectral resolution scanning radiometer has a well- documented calibration history. Once set up, future calibrations of the multifilter instrument will be conducted at the Central UV Calibration Facility (CUCF) in Boulder, CO. The YES broadband instrument is rotated once a year at the GML Mauna Loa Observatory in Hawaii for comparison with another UVB-1 and a spectroradiometer, manufactured by the New Zealand Institute for Water and Atmospheric Research (NIWA). Data from all instruments will be made available to any user upon request, and once QC/QA procedures have been applied, they will be sent to the UV archive in Toronto, Canada.