Preliminary Test Flight Results for LACE

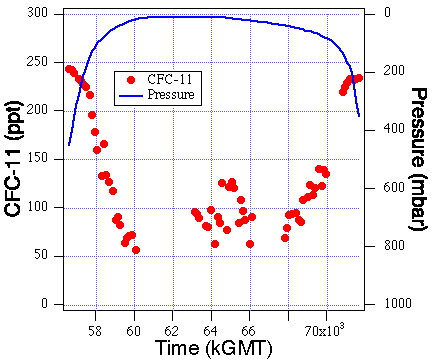
Figure 23 First in situ measurements of CFC-11 ever on a balloon platform.
Plots shows mixing ratios of CFC-11 (right axis, parts per trillion, ppt) and
pressure (left axis, mbar) versus time in seconds (GMT). The maximum altitude
of the flight was 32.4 km. The gaps indicate regions where the pumps were turned
off because of overheating. It was a successful engineering test flight. The
precision of the data will be improved in future flights.

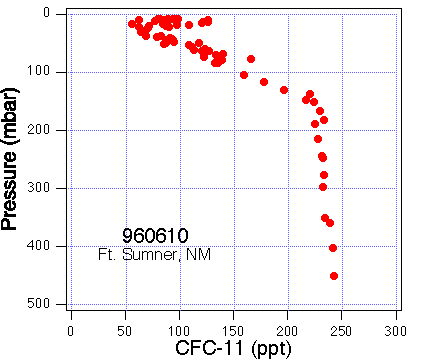
Figure 24 Pressure versus CFC-11 mixing ratios shows the vertical profile.
Note that the profile is bimolal at low pressures indicating a possible contamination
problem.
