
Midwest U.S. Croplands Determine Model Divergence in North American Carbon Fluxes
W. Sun1, Y. Fang2, X. Luo3,4, Y. Shiga1, Y. Zhang4, A.E. Andrews5, K. Thoning5, J.B. Fisher6, T.F. Keenan7,4 and A. Michalak1
1Carnegie Institution for Science, Department of Global Ecology, Stanford, CA 94305; 650-325-1521, E-mail: wsun@carnegiescience.edu
2Bay Area Air Quality Management District, San Francisco, CA 94109
3National University of Singapore, Department of Geography, Kent Ridge, Singapore
4Lawrence Berkeley National Laboratory, Climate and Ecosystem Sciences Division, Berkeley, CA 94720
5NOAA Global Monitoring Laboratory (GML), Boulder, CO 80305
6NASA Jet Propulsion Laboratory, California Institute of Technology, Pasadena, CA 91109
7University of California at Berkeley, Department of Environmental Science, Policy, and Management, Berkeley, CA 94720
Terrestrial biosphere models are key to understanding continental-scale patterns of biospheric carbon fluxes. However, individual models disagree on whether temperate forests or croplands dominate the growing-season net carbon uptake over North America. Evidence from novel photosynthetic proxies has cast doubt on the “strong forest, weak cropland” carbon uptake patterns simulated by most models. To glean robust space-time patterns of North American carbon fluxes from widely divergent model estimates, we need to leverage regional-scale (103–105 km2) constraints from carbon dioxide (CO2) atmospheric observations in model evaluation. Here, we evaluate a large suite of terrestrial biosphere models and data-driven models by examining how well the atmospheric signals resulting from their carbon flux estimates capture the space-time variability in atmospheric CO2, as is observed by a network of tall towers over North America.
Models with gross or net carbon fluxes that are consistent with the observed CO2 variability share a salient feature of strong growing-season carbon uptake in Midwest U.S. croplands. Conversely, the remaining models place most growing-season uptake in boreal or temperate forests. Differences in model explanatory power depend mainly on the simulated timing of peak uptake in croplands rather than the distribution of seasonal cycle amplitudes of fluxes across biomes. Our results suggest that improved model representation of cropland phenology is crucial to robust, policy-relevant estimation of North American carbon exchange.
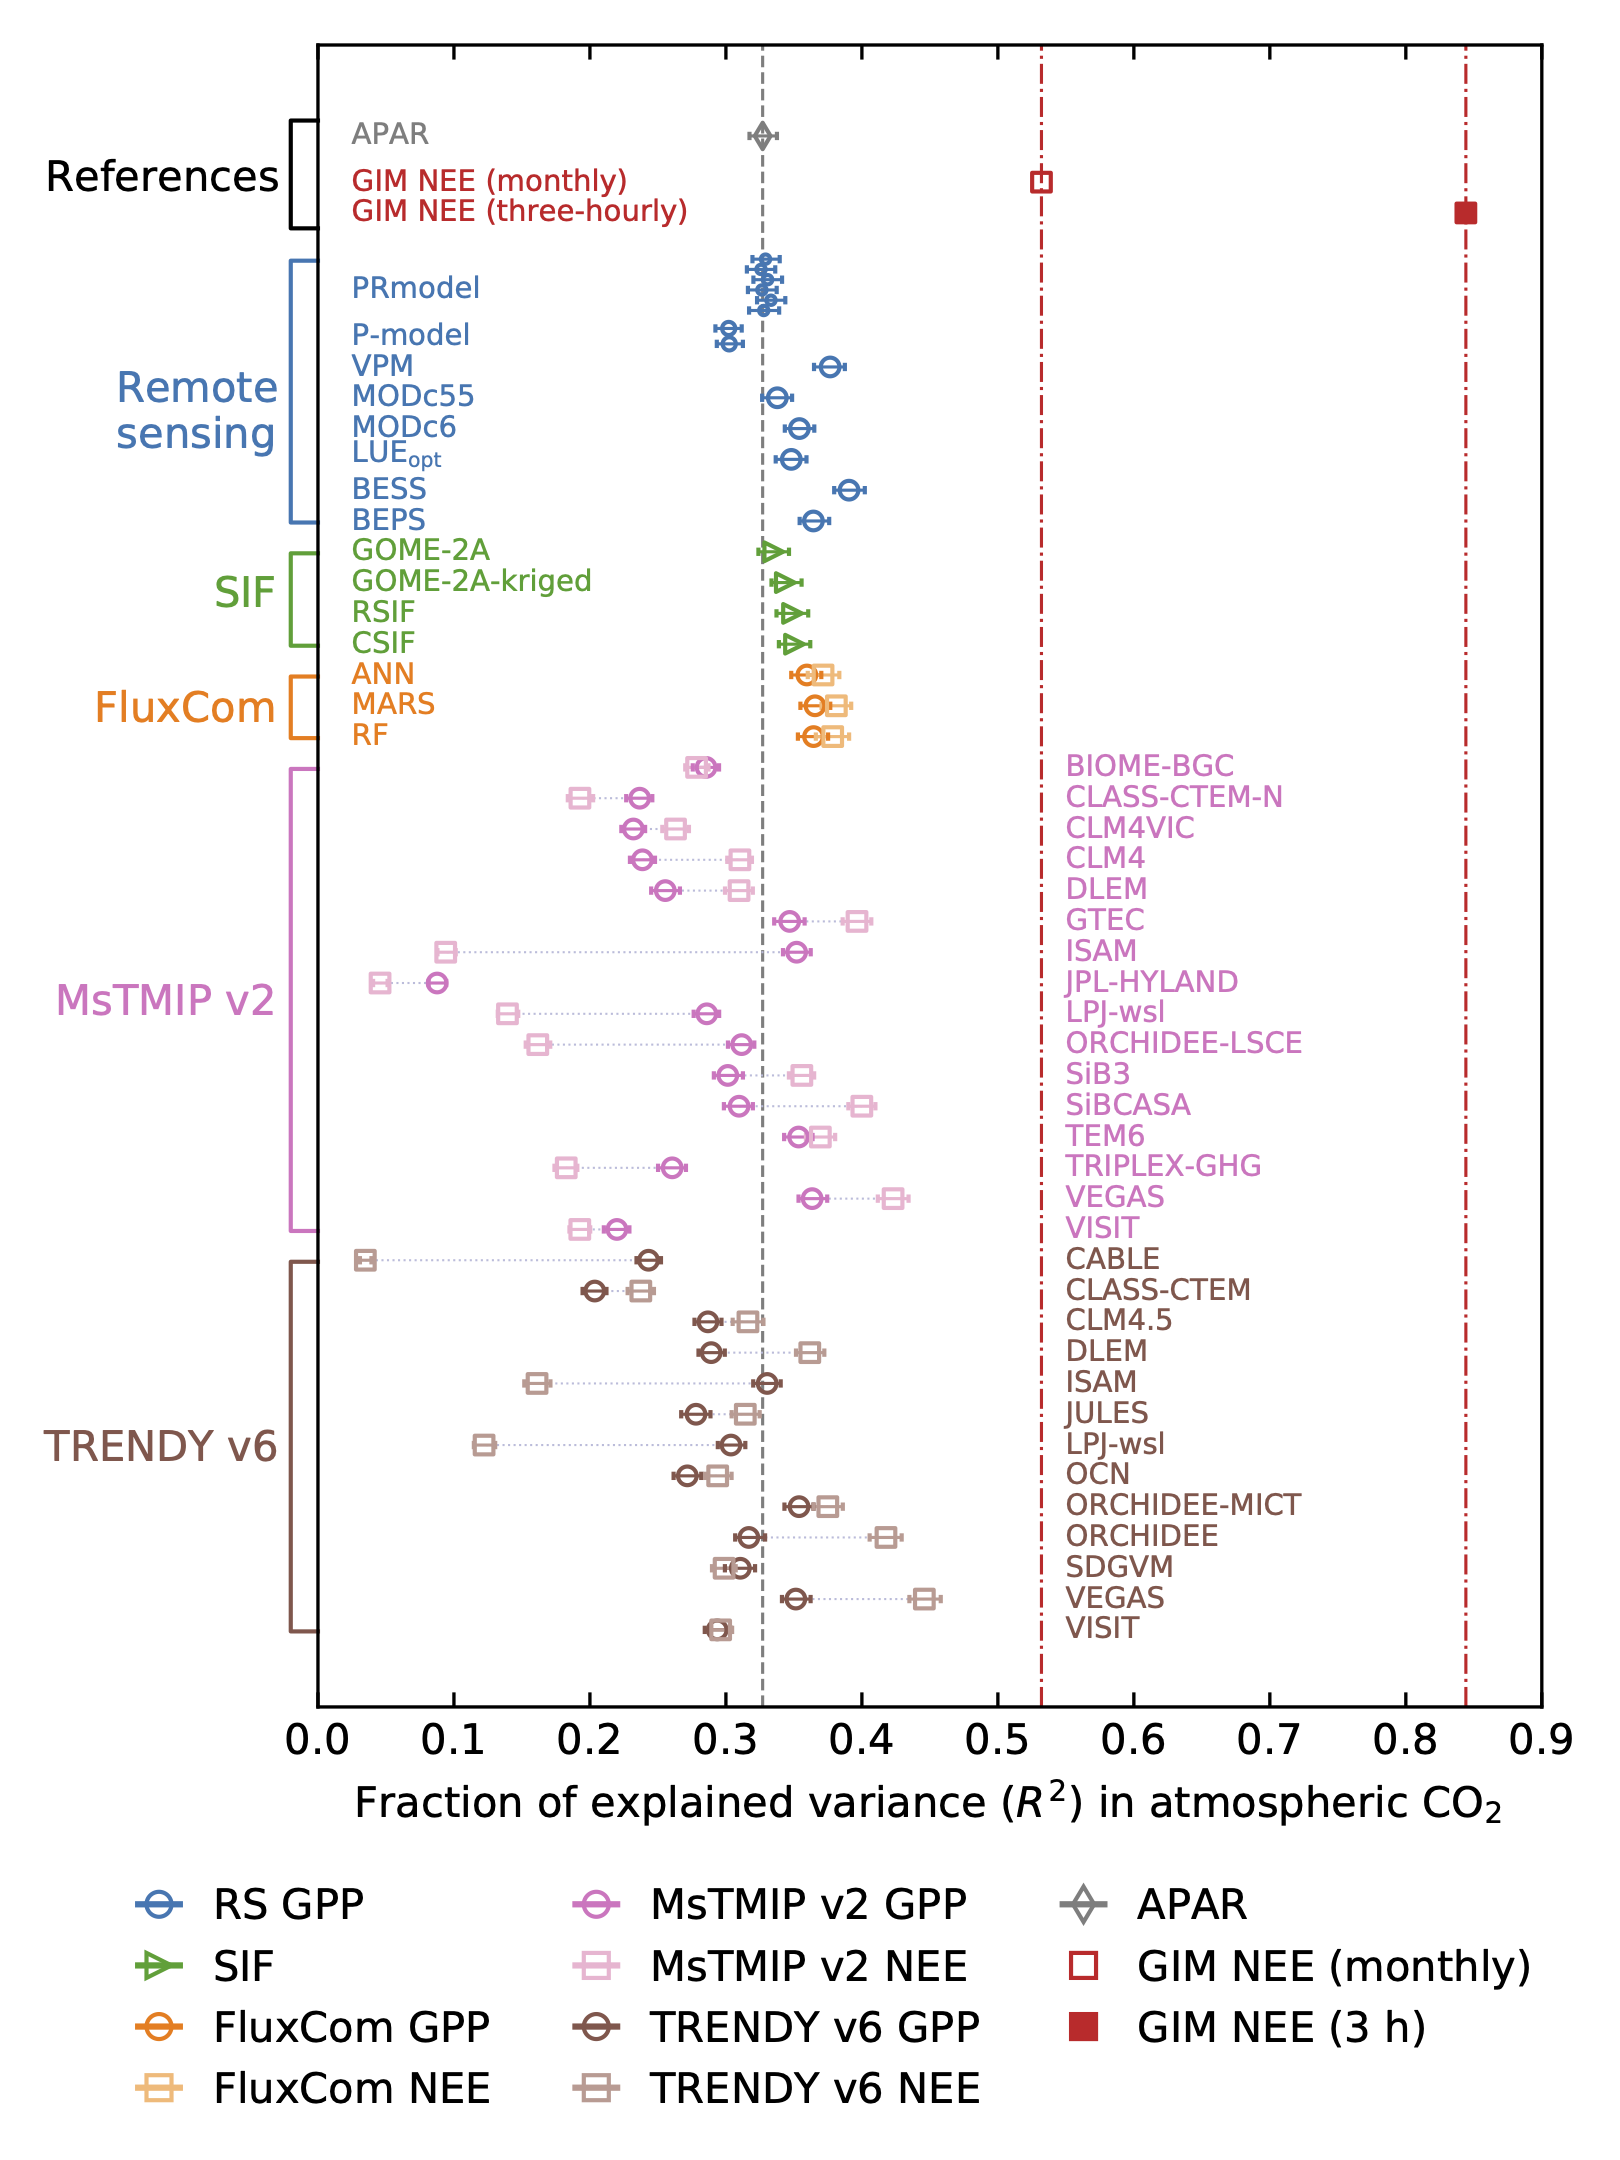
Figure 1. Fraction of variance (R2) in atmospheric CO2 explained by modeled carbon fluxes (GPP and NEE), solar-induced chlorophyll fluorescence (SIF) data products, and the absorbed photosynthetically active radiation (APAR) during 2007–2010, with error bars showing 95% confidence intervals obtained from bootstrapping. For each model with both GPP and NEE estimates, data points that denote R2 values of GPP and NEE of that model are linked by a thin dashed line. The vertical lines denote R2 values of three references (from left to right): APAR and monthly and three-hourly geostatistical inverse estimates of NEE (GIM NEE).
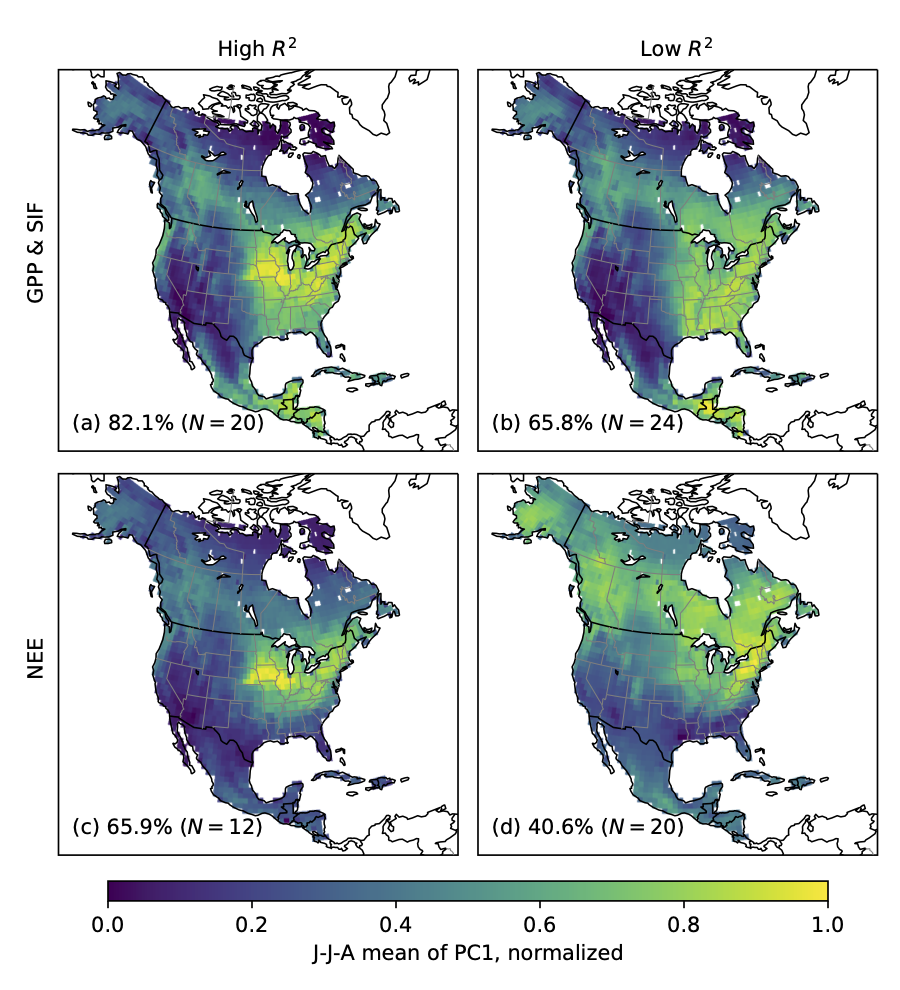
Figure 2. The June–July–August (JJA) mean patterns of the extracted first principal component (PC1) among (a) GPP and SIF models of high R2, (b) GPP models of low R2, (c) NEE models of high R2, and (d) NEE models of low R2, where models of high R2 and of low R2 are separated using the R2 value of APAR (0.327) as a threshold. Percentage numbers represent the fraction of variance in each group explained by the PC1, whereas N indicates the number of models in each group. For both GPP and SIF (a) and NEE (c), models with high R2 show common features of strong summer uptake in the mid-continental cropland region.