
Improving Regional Carbon Flux Quantifications with CO2 Observations from Satellite, Surface, and Aircraft
J. Liu1, A. Chatterjee2, V. Payne1 and The OCO-2/3 Science Team1
1NASA Jet Propulsion Laboratory, California Institute of Technology, Pasadena, CA 91109; 626-567-6008, E-mail: junjie.liu@jpl.nasa.gov
2NASA Goddard Space Flight Center (GSFC), Greenbelt, MD 20771
As climate changes become more severe and many countries pledge to reach carbon neutrality by mid-century, it becomes ever more urgent to improve our understanding of both fossil fuel emissions and natural carbon fluxes using CO2 observations from all platforms. Satellite CO2 observations have the advantage of global coverage, but are prone to biases. Surface CO2 observations are accurate and precise but have limited spatial coverage. CO2 observations collected with aircrafts are limited in both space and time but provide critical vertical information that surface and satellite observations are lacking. In this presentation, we will focus on the advancement in simultaneous use of CO2 observations from these platforms to quantify natural carbon fluxes and fossil fuel emissions, with an emphasis on satellite observations from OCO-2/3. Through comparison to surface remote sensing network TCCON, the retrievals from OCO-2/3 are traced to the WMO standard. We will first show the data quality of OCO-2 and OCO-3 observations during their records. We will then showcase the advancements in three aspects: (1) country-scale carbon budget quantification and how the estimate depends on the observation sources; (2) quantification of impact of extreme climate event on carbon fluxes with regional nested-model (Figure 1); and (3) quantification of regional carbon flux uncertainties with aircraft observations. In the end, we will discuss potential future directions to quantify both anthropogenic emissions and natural carbon fluxes by combining observations from all platforms.
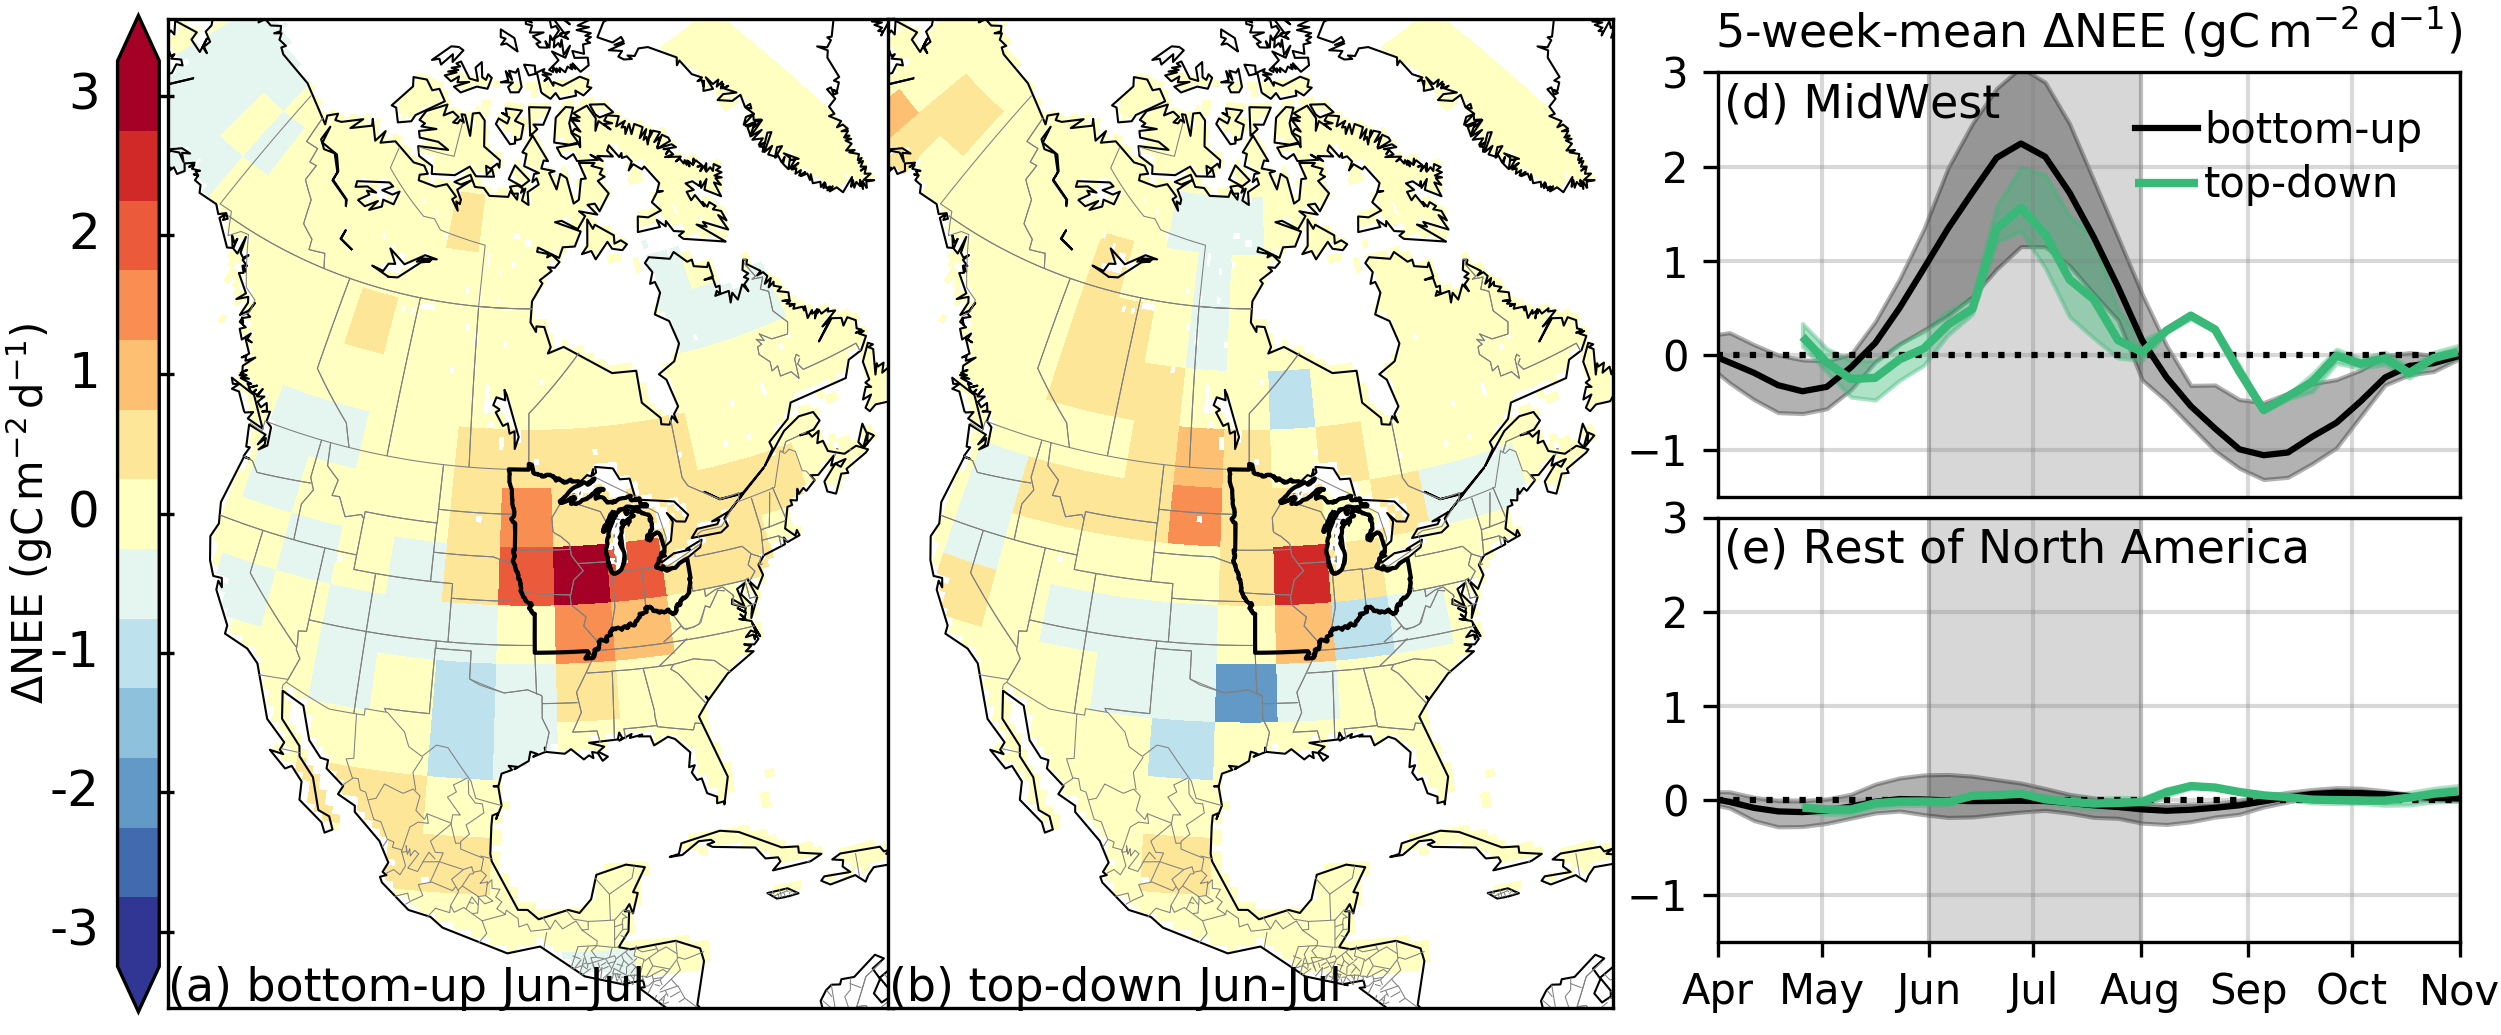
Figure 1. Regional nested-mode inversions better capture flux anomalies caused by extreme flood events in 2020 over mid-west. Left panel: net ecosystem exchange (NEE) anomalies between June-July 2020 inferred from NIRv and SIF observations (unit: gC/m2/day); middle-panel: NEE anomalies between June-July 2020 estimated by a regional nested top-down inversion model; Right panels: monthly NEE anomalies from bottom-up and top-down over the mid west and the rest of north America. (Byrne et al., in preparation).