Aircraft Program Measurements
Analysis of samples
The 12-pack is sent back to NOAA/GML in Boulder, CO, for analysis of as many as 55 trace gases. The gases fall into four broad categories including: greenhouse gases, carbon isotopes, halocarbons and hydrocarbons.

Greenhouse Gases
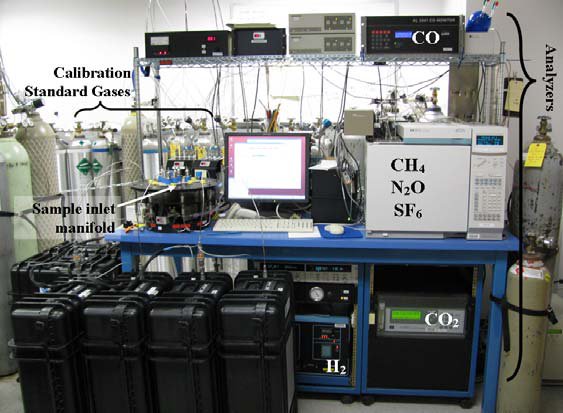
The greenhouse gases are measured by the Measurement of Atmospheric Gases that Influence Climate Change (MAGICC) system on one of two nearly-identical automated analytical systems. The MAGICC systems consist of custom-made gas inlet systems, gas-specific analyzers, and system-control software. The gas inlet systems use a series of stream selection valves to select a specific flask or standard reference gas mixture. Before opening a flask the flask manifold and sample inlet line are evacuated to 40 Pa to ensure that there is no residual gas in the manifold when the flask valve is open. Once the flask valve is open, about 450 ml of sample gas pass through a cold trap maintained at ~-80°C for drying and into one of five trace-gas analyzers. The first 100 ml of each flask sample going into the MAGICC systems is used to flush the sample line and manifold after the evacuation. The second ~50ml of sample flows into a gas chromatograph (GC), which uses an electron capture detector to measure N2O and SF6 with a repeatability of 0.4 ppb and 0.03 ppt respectively (Dlugokencky et al., in preparation, 2010). The third ~50 ml of sample is diverted to a second GC, where pulsed-discharge He ionization isolates H2 before detection, providing a precision of ±0.4 ppb for H2 (Novelli et al., 2009). Two instruments are currently used to measure CO, however individual flasks are not measured on both. CO is also determined by either resonance fluorescence at ~150 nm with a precision of ±0.4 ppb, or by UV absorption spectroscopy with precision ~ 1 ppb (Novelli et al., 1998).
Long-term comparison of the two systems show the GC and fluorescence measurements agree within ~ 1 ppb. A fourth ~50 ml aliquot of sample is diverted to a GC analyzer for flame-ionization detection of CH4 with a precision of ±1.2 ppb (Dlugokencky et al., 1994). Finally, a non-dispersive infrared analyzer measures the last 100 ml of sample for CO2 with a precision of ±0.03 ppm (Conway et al., 1994). The precision of each instrument is determined from 1 standard deviation of ~20 aliquots of natural air measured from a cylinder, except for N2O, which is determined as 1 standard deviation of the mean absolute difference of pairs of samples collected simultaneously in network flasks. Assessed the same way as the other species, instrument precision for N2O is ~0.2 ppb but because there does seem to be a decrease in the reproducibility between flasks, this is reported reproducibility. All measurements are reported as dry air mole fractions relative to internally consistent standard scales maintained at NOAA. We use the following abbreviations for measured mole fractions: ppm = µmol mol-1, ppb = nmol mol-1, and ppt = pmol mol-1.
Halocarbons and hydrocarbons
More than 50 halocarbons, hydrocarbons and sulfur containing trace gases have also been measured at many of the aircraft sites. These measurements are in integral part of the data quality control. The gases are measured using a GC/mass spectrometric technique that requires ~200 ml aliquots from each flask. Each sample is pre-concentrated with a cryogenic trap near liquid nitrogen temperatures. Analytes desorbed at ~140°C are then separated by temperature-programmed GC column (combination 25m x 0.25mm DB5 and 30m x 0.25mm Gaspro), followed by detection with mass spectrometry to monitor compound-specific ion mass to charge ratios. Flask sample responses are calibrated versus whole air working reference gases which, in turn, are calibrated with respect to gravimetric primary standards (NOAA scales: CFC-11 on NOAA-1992, CFC-12 on NOAA-2001, HFC-134a on NOAA-1995, benzene on NOAA-2006 and all other hydrocarbons (besides methane) on NOAA-2008). Absolute uncertainties for analyses reported here are <5%.
Isotopes

A subset of 12-pack flasks is also analyzed for isotopes of CO2 at the University of Colorado INSTAAR Stable Isotope Lab. An automated analysis system allows a ~450 cm3 sample to be analyzed for 13C/12C ratio of CO2 (±0.02‰) and 18O/16O ratio of CO2 (±0.04‰) (Vaughn et al., 2004). As with the MAGICC system, the manifold of each 12-pack is evacuated before the flask valve is opened. The whole air sample flows at 40 cm3/min through one cold trap (-90 °C) to dry samples and a second cold trap (-196 °C) to extract CO2 from whole air sample. The extracted CO2 is then released into a dual inlet isotope ratio mass spectrometer (Isoprime, Elementar, Middlewich, U.K.) and compared against a working reference, which is extracted from whole air collected at Niwot Ridge, CO. Working references have been linked to the VPDB-CO 2 scale by comparison with CO2 evolved from carbonate primary standards (Coplen, 1995). Up to 4 of the programmable flask packages can be automatically analyzed for isotopes in a 24-hour period on the instrument.
A smaller subset of samples is measured for 14C/12C ratio of CO2. The high precision measurements, also denoted as 14CO2, are made through a combination of effort at the University of Colorado INSTAAR Laboratory for AMS Radiocarbon Preparation and Research (NSRL) and the accelerator mass spectrometer at University of California at Irvine. The process begins by: (a) extracting the CO2 from whole air, using a cryogenic extraction system [Turnbull et al., 2009]; (b) reducing the CO2 to elemental graphite over Fe catalyst with Mg(ClO4)2 to remove water; and (c) making the 14C measurement with a high-count accelerator mass spectrometer (AMS) (Turnbull et al. 2007).
