Carbon Monoxide (CO) WMO Scale
Update on the WMO X2014A CO scale – July 2018
The WMO X2014A CO scale is known to have a time dependent bias in the drift corrections applied to the primary standards and there appears to be a bias between the two analytical techniques used for CO calibrations. Read more...
Scale update: WMO CO_X2014A - December 2015
The WMO carbon monoxide in air mole fraction scale has been updated. The new scale (WMO CO_X2014A) updates the X2014 scale to account for drift in the current primary standards (in use since the beginning of 2012) and to finalize assignments to older primary and secondary standards that defined the CO scale from 1993 through mid-2011. Section 1 briefly describes the analytical methods used for CO scale transfer. The definition of the historical CO scale (1993 – 2011) is described in section 2. The changes in the definition of the scale beginning in 2012 and the method used to determine the drift rates of the primary standards are described in section 3. Section 4 discusses the uncertainty in the scale transfer.
All measurements from 1993 – present have been reprocessed from the original raw data using the new assignments for standards on the CO_X2014A scale. Raw data for measurements made before 1993 are not available and their results have not been revised.
1. Analytical methods
Three analytical methods were used to transfer the CO mole fraction scale; gas chromatography with hot mercuric oxide reduction followed by resonance absorption detection of the resulting Hg vapor (GC_HgO), 1993-2005 (Novelli et al., 1991), vacuum ultraviolet resonance fluorescence (VURF) spectroscopy (Gerbig et al., 1996), 2004-2010, and off-axis integrated cavity output spectroscopy (OA-ICOS) (Baer et al., 2002) 2010 – present. The VURF and OA-ICOS methods greatly improved repeatability over the GC_HgO technique. The GC_HgO and OA-ICOS instruments were non-linear over the atmospheric range of CO and were calibrated using multiple standards to define a non-linear response curve. The VURF measurements were calibrated by a single standard between 300 – 400 ppb.
2. Historical definition of the WMO CO scale
Due to the lack of stability of CO in high pressure cylinders, the CO scale has not been maintained with the same methodology as other species. The scales for other species are typically embodied by a single set of stable primary standards that are used over long time periods to provide a consistent scale. The potential for growth of CO in cylinders means that the initial assigned values placed on gravimetric standards cannot be considered valid after some period of time. Typically CO growth becomes significant after 1-2 years but it can be much sooner. Because of this, the CO scale has been defined by repeated sets of gravimetric standards made every few years. Secondary standards are directly calibrated by the gravimetric sets before growth in the gravimetric standards becomes significant. This ties the scale together across multiple gravimetric sets made years apart and allows drift in the secondary standards to be determined.
Historically, two things have complicated the transparency of the CO scale. Not all secondary standards have been measured against all gravimetric sets. This leads to uncertainty in how well the individual sets of gravimetric standards agree with each other. In addition, the definition of primary and secondary standards for CO has not been rigorously maintained. Gravimetric standards were often used initially as primary standards to calibrate secondary standards but were then transitioned into the role of secondary standards. Their values were then re-evaluated by calibrations against future gravimetric sets to determine if they were drifting. This sets up fairly complicated relationships between the primary, secondary, and tertiary standards.
The CO_X2014A scale from 1993 through mid-2011 is defined by six sets of gravimetric standards ( prepared in 1996, 1997, 1999/2000, 2006, 2011, and 2015) that are collectively the CO primary standards for this time period (figure 2.1). Two earlier sets of gravimetric standards (1988/1989 and 1992) are not included in the definition of the CO_X2014A scale. The 1988/1989 standards were made in small 5.9 L cylinders and exhibited very fast growth of CO (subsequent sets were prepared in 29 L cylinders that exhibit much slower growth rates). The results of calibrations against them are suspect because of the rapid drift rates. The 1992 set of gravimetric standards was comprised of only 3 standards so did not cover the range of the scale. They were used mainly as a diagnostic for the 1988/1989 gravimetric standards. In addition, raw data from the early calibration system are no longer available. It is therefore very difficult to relate these early calibration results to the current scale. Calibration results prior to 1993 are not able to be converted to the CO_X2014A scale. The assigned values for secondary standards used from 1993 – 1996 are derived from calibrations against the 1996 and subsequent gravimetric standard sets and drift rates are extrapolated backward in time.
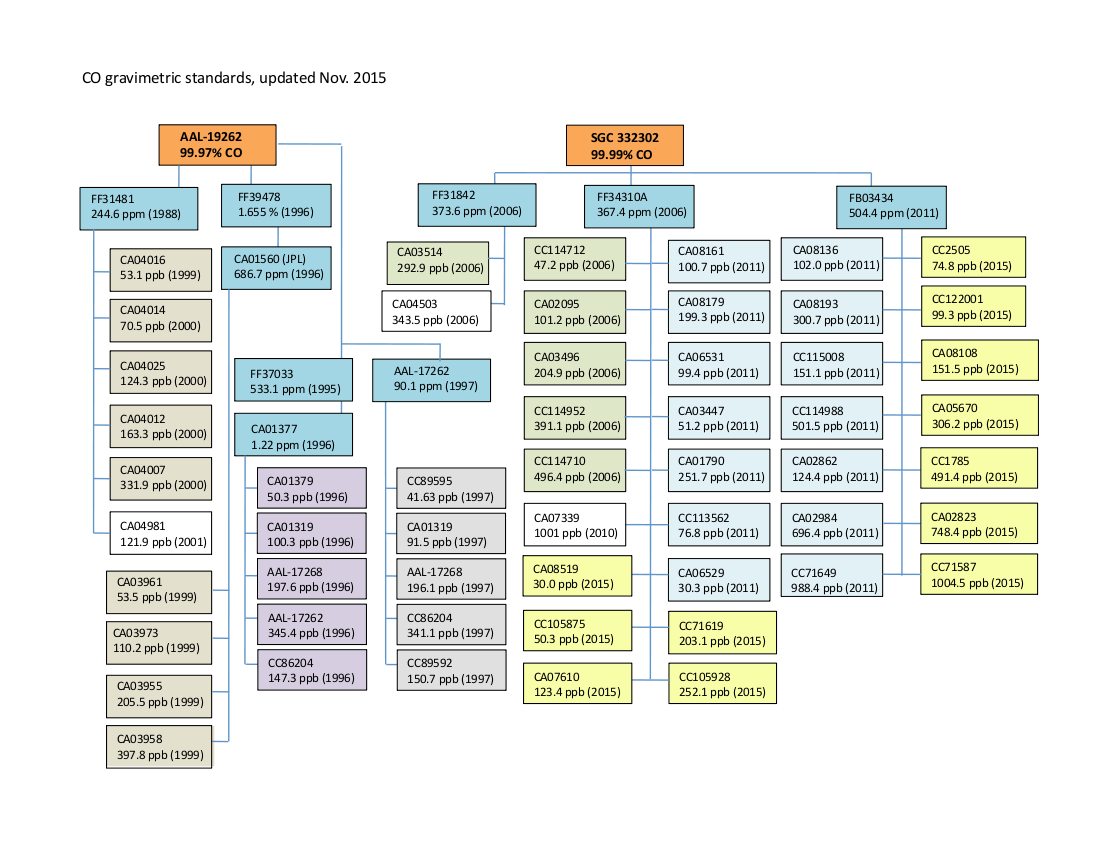
One major uncertainty in the CO scale has been the 1999/2000 set of gravimetric standards. This pivotal set provided the final calibration of many secondary standards that were in use during the 1990s and the first calibration of those used in the 2000s. They therefore have more weight than other sets in determining drift rates for secondary standards. There appears to be a bias in the initial gravimetrically assigned values of the 1999/2000 gravimetric standards below 200 ppb. Subsequent measurements of these standards against the highest two members of the set on the VURF and against subsequent gravimetric standards in 2006 and 2011 showed this bias (table 2.1). The values for these standards were corrected before inclusion in the CO_X2014 scale (the previous scale) but the corrections were not well constrained. CO_X2014A differs from CO_X2014 during 1993 to mid-2011 by the addition of the 2015 gravimetric standards and the additional analysis of several historical secondary (and gravimetric turned secondary) standards against them. The 1999/2000 gravimetric standards were included in this analysis episode and their values and drift rates were re-evaluated. The additional measurements allowed several of the standards to be drift corrected rather than just using a constant value equal to the average of the measurements (table 2.1). Due to the complex relationships between the primary, secondary, and primary turned secondary standards, the uncertainty in the initial values of the 1999/2000 gravimetric standards, and the pivotal position of these standards in the history of the scale, these re-evaluations impacted a large part of the scale.
It should be noted that the 2015 gravimetric standards are only included in the definition of the CO scale prior to July-2011. After this the scale is defined by a strict hierarchy based on the 2011 gravimetric standards (see section 3 below).
Table 2.1: 1999/2000 Gravimetric Standards
| ID | Preparation1 | VURF2 Vs. High 2000 primary | VURF3 Vs. 2006 primary | OA-ICOS4 Vs. 2011 primary | OA-ICOS5 Vs. 2015 primary | X2014 Value + drift rate6 | X2014A Value + drift rate6 |
|---|---|---|---|---|---|---|---|
| CA04016 | 53.1 (0.6) | 59.3 (0.7) | 59.7 (0.9) | NA | 62.9 (0.4) | 59.8 | 57.8 + 0.32 |
| CA03961 | 53.5 (0.7) | 56.8 (0.4) | NA | 57.3 (0.4) | 58.9 (0.4) | 56.6 | 55.5 + 0.21 |
| CA04014 | 70.5 (0.6) | 76.8 (0.4) | 77.7 (0.7) | 78.6 (0.5) | 80.1 (0.5) | 77.2 | 75.5 + 0.29 |
| CA03973 | 110.3 (0.9) | 118.9 (0.5) | NA | 122.4 (0.4) | 124.3 (0.4) | 118.9 + 0.41 | 116.8 + 0.47 |
| CA04025 | 124.5 (0.7) | 127.0 (0.6) | NA | 129.1 (0.6) | 130.8 (0.4) | 125.6 | 125.4 + 0.34 |
| CA04012 | 163.3 (0.7) | 170.6 (0.9) | NA | 173.8 (0.6) | 174.9 (0.5) | 171.0 | 169.1 + 0.37 |
| CA03955 | 208.2 (1.0) | 207.9 (1.0) | 207.8 (1.0) | 207.7 (0.7) | 207.8 (0.6) | 207.3 | 207.8 |
| CA04007 | 331.9 (0.8) | NA | 336.5 (1.2) | 341.4 (1.1) | 342.0 (1.3) | 332.0 + 0.57 | 332.5 + 0.63 |
| CA03958 | 398.2 (0.9) | NA | 398.7 (1.3) | 401.0 (1.3) | 398.8 (1.3) | 398.5 | 398.52 |
1 Gravimetrically assigned CO mole fractions. Prepared September 1999 - March 2000
2 Measured relative to the highest two members of the 2000 gravimetric standards by VURF, July - Dec 2004.
3 Measured relative to the 2006 gravimetric standards by VURF, November - December 2006.
4 Measured relative to the 2011 gravimetric standards by OA-ICOS January - April 2012.
5 Measured relative to the 2015 gravimetric standards by OA-ICOS September - October 2015.
6 Drift rates are ppb per year
History of the 1999/2000 gravimetric standards including initial gravimetrically assigned values and calibration results vs. subsequent sets of gravimetric standards. Uncertainties are 68% confidence intervals and include absolute scale uncertainty and measurement uncertainty. The assignments for each standard on the X2014 and X2014A scales are also shown. The additional measurement verses the 2015 gravimetric standards allowed many of the standards to be drift corrected rather than use a constant average value.
3. WMO CO scale 2012 – present:
In 2012, the CCL changed the method used to define the CO scale to improve transparency and long term (decadal) consistency of the scale. The 2011 gravimetric standards were designated as the primary CO standards with the intention of maintaining these standards as the primary CO standards over time. There are 14 primary standards covering the nominal range 30 – 1000 ppb CO (see table 3.1). Secondary standards (and tertiary standards) are traceable only to this single set of primary standards through a strict hierarchy since July 2011 (the date at which the current secondary standards went into service). The primary standards are drifting upwards leading to biased results for tertiary standards calibrated by the CCL. The CO_X2014A scale revision corrects this drift.
Table 3.1: CO Primary Standards
| ID | Gravimetric Value (unc) ppb |
Avg - Internal Tracer (unc) ppb |
Drift Rate (unc) ppb/yr |
|---|---|---|---|
| CA06529 | 30.32 (0.18) | 31.92 (0.4) | 0.48 (0.11) |
| CA03447 | 51.21 (0.22) | 52.39 (0.3) | 0.35 (0.11) |
| CC113562 | 76.57 (0.28) | 77.84 (0.3) | 0.38 (0.15) |
| CA06531 | 99.37 (0.33) | 101.45 (0.4) | 0.61 (0.15) |
| CA08161 | 100.69 (0.34) | 103.71 (0.4) | 0.84 (0.15) |
| CA08136 | 102.10 (0.32) | 105.89 (0.4) | 1.07 (0.14) |
| CA02862 | 124.35 (0.39) | 125.20 (0.4) | 0.26 (0.17) |
| CC115008 | 151.12 (0.45) | 153.30 (0.4) | 0.64 (0.2) |
| CA08179 | 199.32 (0.59) | 201.95 (0.5) | 0.73 (0.2) |
| CA01790 | 251.68 (0.74) | 252.37 (0.5) | 0.20 (0.3) * |
| CA08193 | 300.65 (0.85) | 302.83 (0.6) | 0.62 (0.3) |
| CC114988 | 501.48 (1.41) | 502.70 (0.8) | 0.37 (0.5) * |
| CA02984 | 696.37 (1.96) | 695.61 (1.2) | -0.23 (0.6) * |
| CC71649 | 988.42 (3.97) | 991.07 (2.1) | 0.81 (1.2) * |
The primary CO standards, initial gravimetrically assigned values, average measurement results from the internal tracer method, and the drift rate determined. All uncertainties are 68% confidence intervals and include all known contributions to the uncertainty.
* The drift rates determined for these tanks are not considered significant within the known uncertainties of the technique. The weighted average of the initial gravimetric value and the average internal tracer method result is used for the X2014A assigned value.
An internal tracer method has been developed to track growth of CO in the primary standards. This method takes advantage of the stability of the CH4 scale and the assumption that CO growth in cylinders is a wall effect and is not mole fraction dependent. Three very high mole fraction gravimetric mixtures of CO and CH4 in air were made. These "parent" tanks contain 0.1 – 1% CO and ~ 3% CH4 (see table 3.2). They are made gravimetrically such that the CO:CH4 ratio is known with small uncertainty. Typical growth rates of CO in cylinders, a few ppb per year at the most, is insignificant compared to the amount of CO in the parent tanks giving a stable CO:CH4 ratio. Static dilutions from the parent tanks are made by blending small aliquots of parent gas with scrubbed zero air in 5.9 L aluminum Luxfer cylinders. By varying the size of the parent aliquot, various CO mole fractions can be targeted to cover the range of the primary standards. The CH4 mole fractions in these "dilution" standards are measured relative to the WMO CH4 scale and used with the known CO:CH4 ratio of the parent tank to assign a CO value to the dilution standard (correcting for CH4 and CO in the diluent gas). Dilution standards can be made repeatedly from the stable parent tanks (total uncertainties range from 0.2 to 1.2 ppb, 68% confidence intervals). Suites of 12-16 dilution standards are made and used to prepare an instrument response curve to calibrate the primary standards. This is done multiple times per year to allow the rate of change in the primary standards to be determined. Table 3.3 lists the dilution standards made for the August 2015 calibration episode. The diluent gas is passed through a 430 g Sofnocat trap, so the assumed CO in the diluent is 0 (±0.2) ppb. The total uncertainty (measurement uncertainty plus absolute uncertainty in the scale) of the CO assignment is calculated taking into account the uncertainties in the parents, CH4 and CO in the diluent gas, and the measurement of the CH4 mole fraction.
Table 3.2: Internal Tracer Parent Tanks
| Id | % CO (unc) | % CH4 (unc) | CO:CH4 ratio (unc) |
|---|---|---|---|
| FB03858 | 0.1674 (0.0002) | 3.7710 (0.0048) | 0.0444 (0.0019) |
| FB03863 | 0.8763 (0.0002) | 2.8798 (0.0007) | 0.3043 (0.0003) |
| FB03885 | 0.3452 (0.0002) | 3.2606 (0.0005) | 0.1059 (0.0005) |
The CO, CH4, and CO:CH4 ratios of the three high mole fraction parent tanks used in the internal tracer method. Uncertainties are 68% confidence intervals from the gravimetric production of the parent tanks.
Table 3.3: Dilution standards for internal tracer method, August 2015 calibration episode
| ID | Parent | Diluent | [CH4]z | [CO]z | [CH4]m (unc) | [CO]assigned (unc) |
|---|---|---|---|---|---|---|
| FF32810 | FB03858 | CB10223 | 4.5 | 0.0 | 557.6 (1.6) | 24.6 (0.2) |
| FF32779 | FB03858 | CB10223 | 4.5 | 0.0 | 1082.5 (1.1) | 47.9 (0.2) |
| FB04080 | FB03885 | CB09903 | 4.5 | 0.0 | 551.1 (1.7) | 57.9 (0.3) |
| FB03876 | FB03858 | CB10223 | 4.5 | 0.0 | 1759.5 (1.8) | 77.9 (0.2) |
| FB04083 | FB03885 | CB09903 | 4.5 | 0.0 | 775.6 (1.6) | 81.6 (0.3) |
| FB03856 | FB03858 | CB10223 | 4.5 | 0.0 | 2204.2 (2.2) | 97.7 (0.3) |
| FB03884 | FB03858 | CB10223 | 4.5 | 0.0 | 2829.6 (2.8) | 125.4 (0.3) |
| FB04095 | FB03885 | CB10223 | 4.5 | 0.0 | 1189.1 (1.2) | 125.4 (0.2) |
| FB03850 | FB03863 | CB09903 | 4.5 | 0.0 | 481.7 (1.4) | 145.2 (0.6) |
| FB03861 | FB03858 | CB10223 | 4.5 | 0.0 | 3433.9 (3.4) | 152.2 (0.3) |
| FB04096 | FB03885 | CB10223 | 4.5 | 0.0 | 1786.0 (1.8) | 188.6 (0.3) |
| FB03852 | FB03863 | CB09903 | 4.5 | 0.0 | 794.0 (1.6) | 240.2 (0.6) |
| FB03851 | FB03863 | CB09903 | 4.5 | 0.0 | 1101.5 (1.1) | 333.8 (0.5) |
| FB03869 | FB03863 | CB09903 | 4.5 | 0.0 | 1737.6 (1.7) | 527.4 (0.7) |
| FB03888 | FB03863 | CB09903 | 4.5 | 0.0 | 2450.2 (2.5) | 744.2 (0.9) |
| FB04059 | FB03863 | CB09903 | 4.5 | 0.0 | 3505.0 (3.5) | 1065.3 (1.2) |
Dilution standards made during the August 2015 internal tracer calibration episode. The dilution standards are made from the three parent tanks, with overlap in mole fraction. The diluent gas was measured for CH4 and the results are shown ([CH4]z). The diluent gas is passed through a 430g Sofnocat trap so the assumed CO mole fraction in the diluent gas ([CO]z) is 0. The CH4 measured in each of the dilution standards ([CH4]m) and the total uncertainty of the CH4 measurements are shown in the sixth column. The total uncertainty of the CH4 measurement includes the absolute uncertainty of the CH4 scale as well as the internal consistency of the scale transfer which is typically used by the WMO community as an estimate of the uncertainty on CH4 standards. The assigned CO value for each tank ([CO]assigned) is determined by [CO]assigned = ( ( [CH4]m – [CH4]z) * ParentRatio) + [CO]z ). All uncertainties are expressed as 68% confidence intervals.
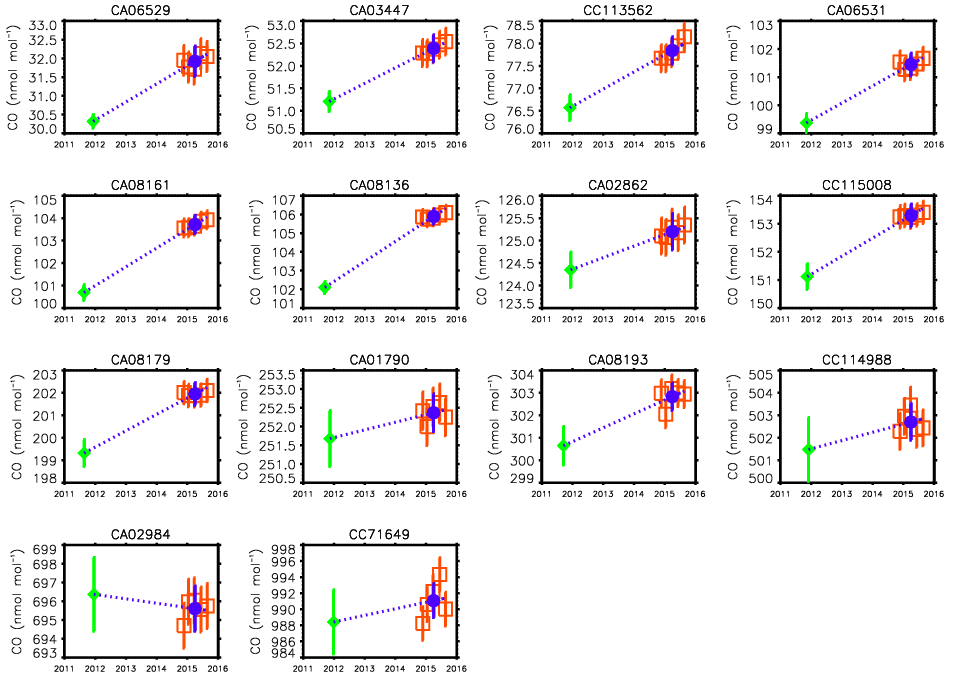
The primary CO standards (the 2011 gravimetric standard set) were calibrated 5 times from November 2014 – August 2015 on a Vacuum Ultraviolet Resonance Fluorescence (VURF) spectrometer using the internal tracer method. A new suite of dilution standards was made for each calibration episode. The dilution standards are used to calibrate the instrument within 2-3 days of being produced to minimize any CO growth in the dilution standard cylinders. Figure 3.1 shows the results for each primary standard along with the initial gravimetrically determined values. The total uncertainties shown, which include all known sources of uncertainty, are 68% confidence intervals for both. There are only five measurement episodes so far, therefore we do not have enough data to determine the rate of change without including the initial gravimetric values in the fits. The small number of data points and the time gap between the initial gravimetric values and the internal tracer technique measurements makes determining significance of the implied drift rates through a reduced chi square test difficult. Therefore we treat the internal tracer technique measurements as replicate measures of the same quantity and average the five results into a single internal tracer technique value for each standard (also shown in figure 3.1). The uncertainty of the average internal tracer technique value is assigned as the total uncertainty of the technique, not the standard deviation of the replicate measurements. These results indicate that significant changes in CO mole fraction have occurred in all but four primary standards since they were prepared in 2011 (most at 95% confidence level, one at the 68% confidence level). For each primary standard the rate of change was determined from the initial gravimetric value and the average internal tracer technique value (Table 3.1). These drift rates are applied as time-dependent corrections to the initial gravimetric values. The four primary standards where the measurements and initial values are not considered significantly different are reassigned as a constant value equal to the weighted average of the initial gravimetric value and the average internal tracer technique value.
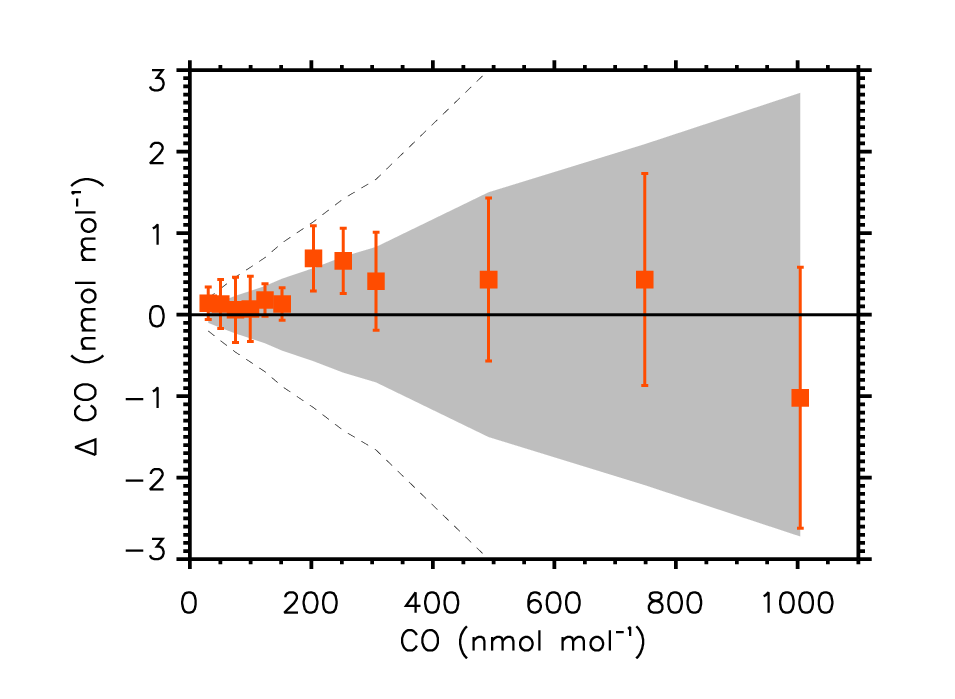
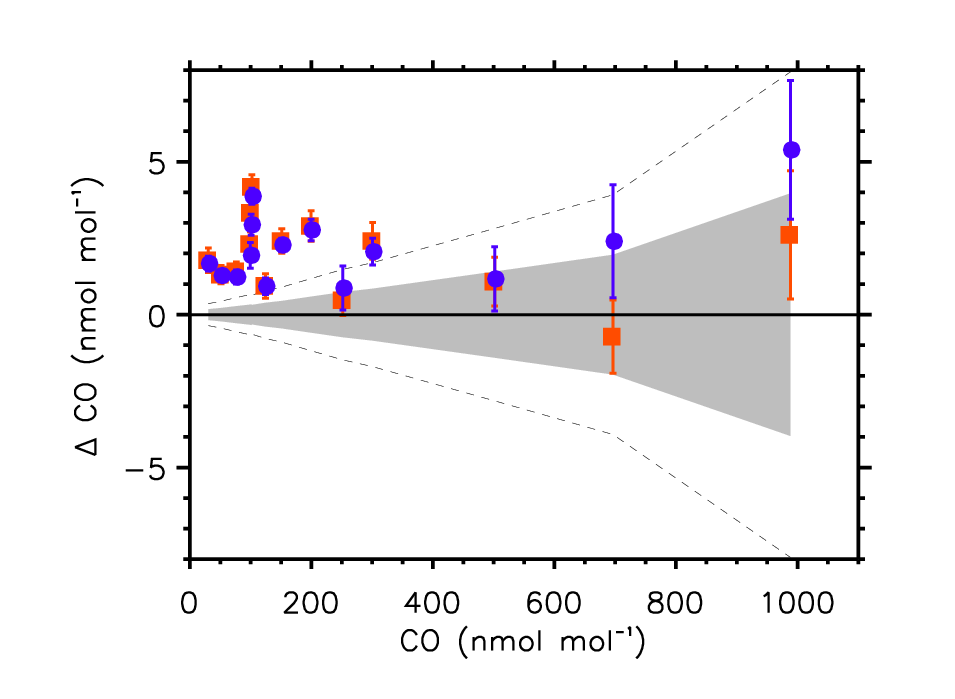
These calculated drift rates assume that there is no bias between the initial gravimetric values and the internal tracer technique. To evaluate the internal tracer method for potential bias a new suite of gravimetric CO standards was produced in July 2015 (12 standards covering the range 30 to 1000 ppb). These new gravimetric standards, referred to as the 2015 gravimetric standards, were measured against a suite of dilution standards in August 2015. The results (with total measurement uncertainties at 68% confidence intervals) are shown in figure 3.2 along with the 68% and 95% confidence intervals of the 2015 gravimetric standards. The results agree within the 68% gravimetric uncertainties except for two cylinders, the 30 and 200 ppb standards, and these measurements are within a 95% initial gravimetric uncertainty envelope. There is an average offset of 0.2 (±0.4) ppb between the measurements and the gravimetric values. It is not clear if this would be the case for all gravimetric standards or just for the 2015 set. We do not correct the measurements for this potential bias but do include it in the total uncertainty calculations used above. It should become clearer with a longer time series of measurements and with comparison to future gravimetric standards. Figure 3.3 shows the primary standards measured directly against the 2015 gravimetric standards in August 2015 and the calculated value for each primary standard in August 2015 using the drift rates derived from the internal tracer method. Each standard is plotted as a difference from its initial gravimetric assigned value. The 68% and 95% confidence intervals from the initial gravimetric values are shown. The results of the measurements directly against the 2015 gravimetric standards show excellent agreement with the internal tracer method and both data sets show that most of the tanks are significantly different from their initial assignments.
The drift rates determined for the primary standards are propagated to the secondary standards that have been in use since July 2011 and then to all tertiary standards calibrated against the secondary standards during this time period. Calibration histories of several long term target tanks before and after the X2014A scale revision are shown in figure 3.4. The results are more consistent with the X2014A revision applied. However there may be too much drift applied, leading to an upward enhancement at the end of some of the records, and small inconsistencies between the results when instrumentation was switched (from the GC_HgO to the VURF in 2004 and from the VURF to the OA-ICOS in 2010).

A longer time series is required to better define the derived drift rates for the CO primary standards that form the basis for the CO_X2014A scale revision. However, the excellent agreement with the 2015 gravimetric standards shows progress. These drift rates are currently the best measure of the rate of change in the primary standards and give a much more consistent scale. The primary standards will continue to be measured against new suites of dilution standards 2-3 times per year. The new measurements will be evaluated and appropriate future scale revisions will be made when warranted.
4. Scale transfer uncertainty
The total uncertainty of the CO_X2014A scale is being evaluated and will be addressed in a forthcoming publication. Of importance to the WMO community is the consistency with which the scale has been propagated over time. This is estimated from the reproducibility of measurements of long-term target tanks and other tertiary standards. Early measurements, when the CCL was using the GC_HgO technique (1993 – 2005), are substantially less precise than the measurements on the VURF or OA-ICOS instruments (2004 – present). We therefore define two reproducibility estimates, for the GC_HgO measurements from 1993 – 2005 and the VURF/OA-ICOS measurements from 2004 – present. All reproducibility estimates given here are 95% confidence intervals.
The current long term target tanks cover the nominal range 25 to 500 ppb and provide very good estimates of the scale transfer consistency from 2001 – present. Figure 4.1 shows the calibration histories of the long term target tanks color coded by analytical methods. A liner fit is applied to all the measurements to account for growth of CO in the target tanks and the standard deviation of the residuals to the fit is taken as the reproducibility of the scale transfer. The reproducibility of the scale transfer is ±0.8 ppb for the VURF/ OA-ICOS measurements and ±1.8 ppb for the GC_HgO measurements. The reproducibility of measurements at the high end of the scale (greater than 300 ppb) may have more uncertainty on the VURF and OA-ICOS than less than 300 ppb. The nominal 480 ppb target tank is relatively new and has only 6 measurements. It appears to be slightly more noisy (±1.4 ppb) than the other target tanks indicating an increase in uncertainty at high mole fractions. In addition, a separate nominal 1000 ppb gravimetric standard has been measured as an unknown 10 times since 2010. Most of these measurements were made verses secondary standards that topped out at 500 ppb so are influenced by extrapolation errors. Including the measurements that were large extrapolations, the reproducibility at 1000 ppb is ±15 ppb which again indicates larger uncertainties for higher mole fraction measurements. This value improves since May 2014 when secondary standards at 750 and 1000 ppb were added and will be re-evaluated in the future. The addition of other high mole fraction target tanks is planned to better constrain the uncertainty of the scale transfer.
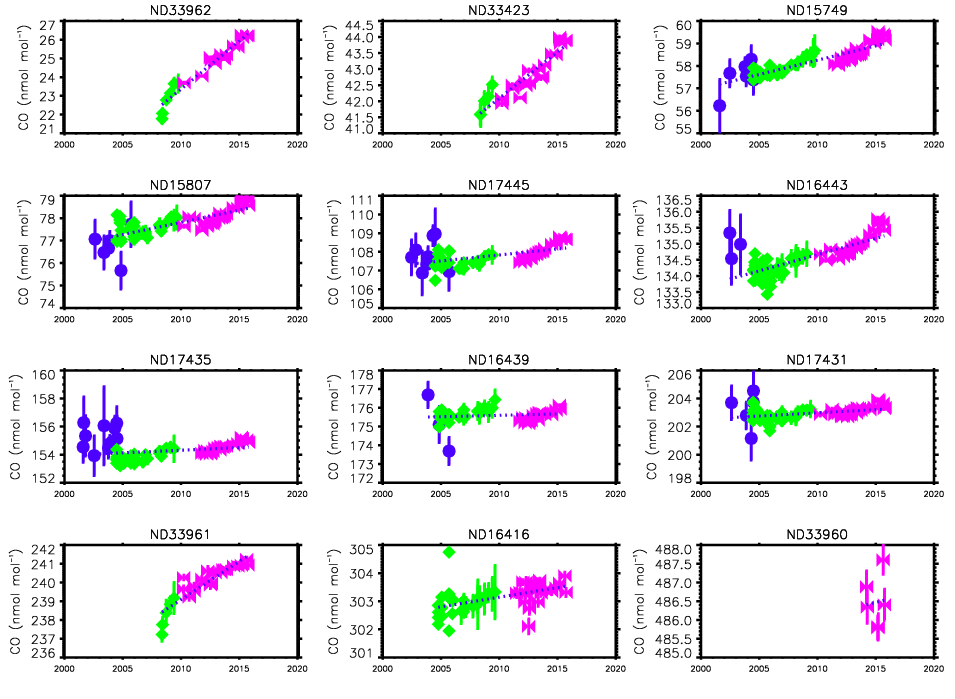
Since measurements of the current long term target tanks began in 2001, 15 other tertiary cylinders measured more than four times over several years were evaluated for the 1993 – 2001 GC_HgO measurement period. These cylinders were not measured well enough to define a drift rate, so the standard deviation of the measurements (un-corrected for any drift in the cylinders) was used as a measure of the reproducibility. The average during this time period was ±3.0 ppb. This may be a slight overestimate since any growth of CO in the cylinders would be incorporated into these values. Taken with the results from the current long term target tanks measured by GC_HgO, the reproducibility of the entire GC_HgO period is estimated at ±2.6 ppb. Table 4.1 summarizes the reproducibility estimates for the scale transfer.
Table 4.1 Scale transfer reproducibility, 95% confidence intervals
| Mole Fraction Range | GC_HgO measurements1 | VURF/OA-ICOS measurements |
|---|---|---|
| 25-50 | NA | 0.8 ppb |
| 50 – 300 | 2.6 | 0.8 |
| Nominal 500 | NA | 1.4 |
| Nominal 10002 | NA | 15 |
1 Measurements on the GC_HgO outside of the range of the standards (< 50 ppb and greater than 300 ppb) are influenced by extrapolation of the quadratic instrument calibration curves. These uncertainty estimates do not apply in those cases.
2 Uncertainty of measurements of the 1000 ppb cylinder were influenced by response curve extrapolation errors prior to May 2004. The uncertainty of measurements at high mole fractions will be re-evaluated when more data is available.
References:
- Baer D. S., et al., Sensitive absorption measurements in the near-infrared region using off-axis integrated cavity output spectroscopy, Appl. Phys. B, 75, 261-265, 2002.
- Gerbig C, et al., An improved fast-response vacuum-UV resonance fluorescence CO instrument, JGR, 104, 1699-1704, 1999.
- Hall et al., The NOAA nitrous oxide standard scale for atmospheric observations, JGR, 112, D09305, doi:10.1029/2006JD007954, 2007.
- Novelli et al., Development and evaluation of a gravimetric reference scale for measurements of atmospheric carbon monoxide, 1991, JGR, 96, 13109-13121, 1991.
