
Standard Reference Gases
NOAA Calibration Scales for Various Trace Gases
Scales for WMO GAW CCL
A World Meteorological Organization (WMO) Central Calibration Laboratory (CCL) is responsible for maintaining and distributing the WMO Mole Fraction scale for a specified gas in air. NOAA GML is the WMO, Global Atmosphere Watch (GAW) CCL for CO2, CH4, N2O, SF6, and CO.
| Species | Current Scale | N | Range |
|---|---|---|---|
| CO2 | WMO CO2 X2019 | 19 | 250-800 ppm |
| CH4 | WMO CH4 X2004A | 16 | 300-5000 ppb |
| CO | WMO CO X2025 | 14 | 25-1000 ppb |
| N2O | WMO N2O 2006A | 14 | 260-370 ppb |
| SF6 | WMO SF6 X2014 | 17 | 2-20 ppt |
Scales for other Gases
NOAA/GML also maintains internal scales for a number of trace gases that are not part of the set of WMO GAW CCL scales (CO2, CH4, CO, N2O, SF6).
Scales are defined by a specific set of primary standards. Mixing ratios (expressed as dry air mole fraction) are assigned to the primary standards based on the mean repsonse observed on GC-ECD or GC-MSD instruments. For ECD instruments, a polynomial fit relating response to mixing ratio is used to assign values. For GC-MSD it is simply the mean molar response.
Current calibration scales for a number of trace species measured by GML are summarized in the table below. The table defines each scale and conversion factors used to update data from older scales. This table was originally published in NOAA/CMDL Summary Report No. 27 (2004). The most recent version of this table is updated on this website.
The scales shown are tied to a specific set of primary standards [Hall et al., 2001] and named
according to the year in which they were adopted. Thus, the preparation and use of new primary
standards for a particular compound results in a new scale for that compound.
Also shown in Table 1 is the number of primary standards used to define
each scale and the concentration range of those standards.
| Species | Previous Scale | Current Scale | Note | N | Range |
|---|---|---|---|---|---|
| CFC-12 | 2001 | 2008 | 1 | 15 | 150-650 ppt |
| CFC-11 | 1992 | 2016 | 5 | 100-260 ppt | |
| CFC-113 | 2003 | no change | 10 | 20-110 ppt | |
| CH3CCl3 | 2003 | no change | 10 | 10-180 ppt | |
| CCl4 | 1996 | 2008 | 2 | 7 | 25-150 ppt |
| halon 1211 | 1996 | 2006 | 3 | 5 | 3-7 ppt |
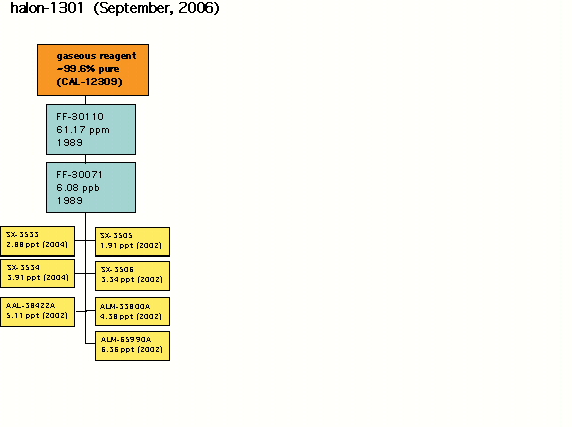
| halon 1301 | 1990 | 2006 | 4 | 6 | 2-5 ppt |
| HCFC-22 | 1992 | 2006 | 5 | 9 | 75-200 ppt |
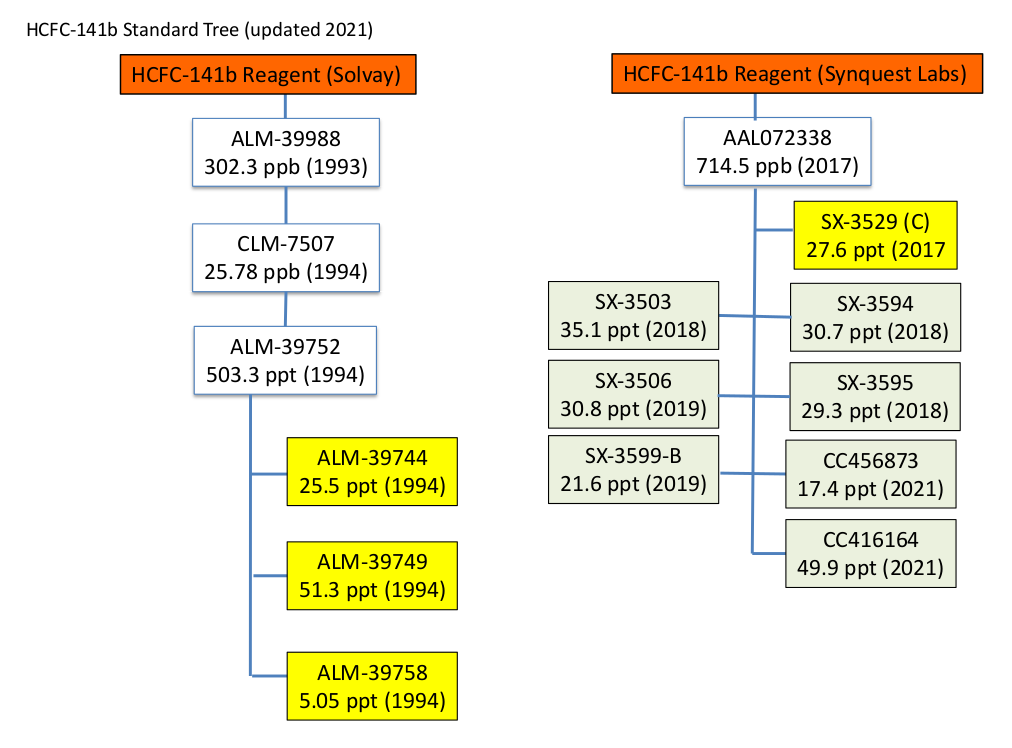
| HCFC-141b | 1994 | no change | 3 | 5-50 ppt | |
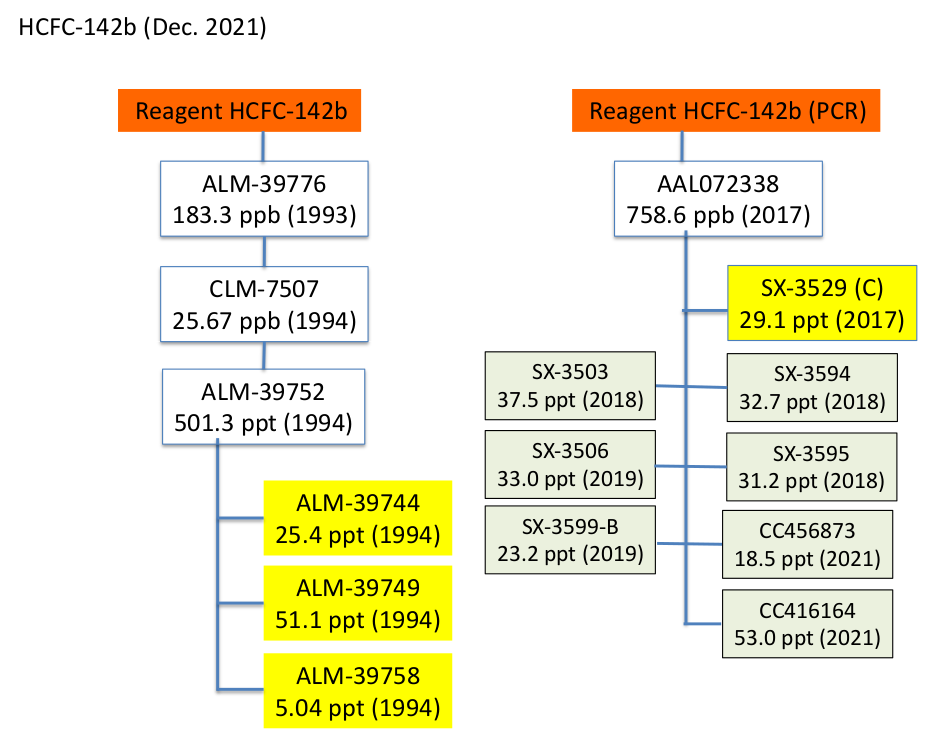
| HCFC-142b | 1994 | no change | 3 | 5-50 ppt | |
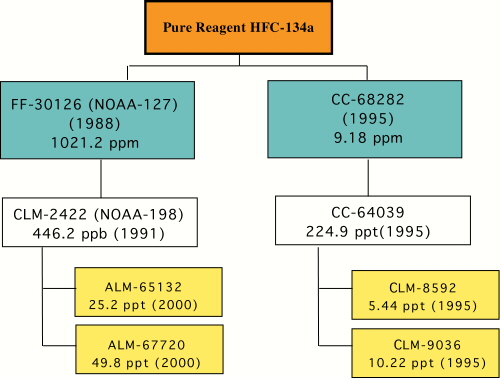
| HFC-134a | 1995 | no change | 2 | 5-10 ppt | |
| HFC-152a | None | 2004 | 2 | 5-11 ppt | |
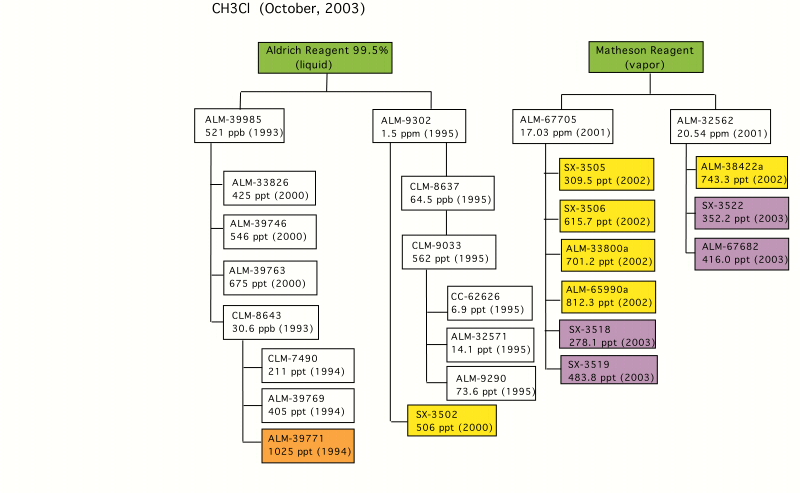
| CH3Cl | 2003 | no change | 9 | 280-810 ppt | |
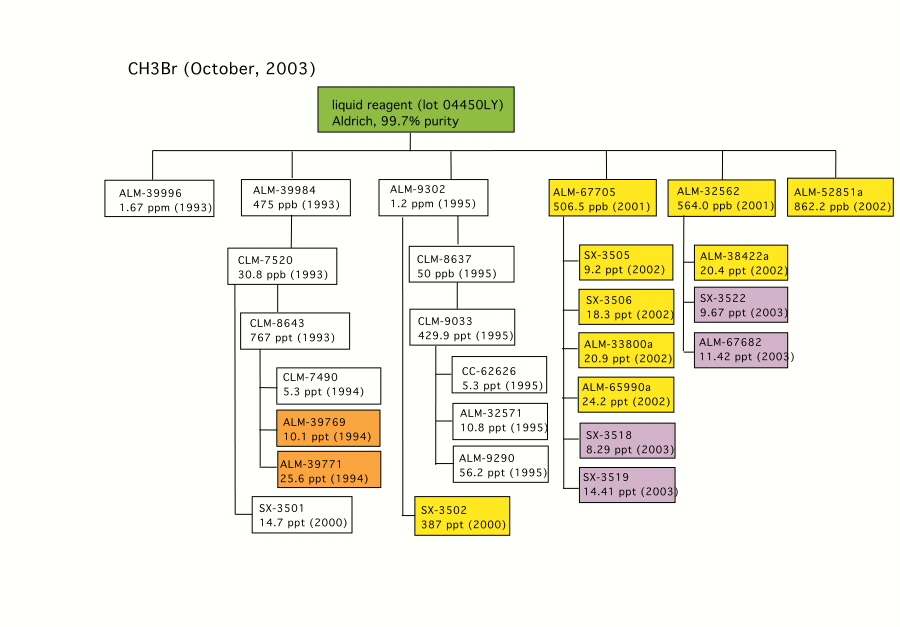
| CH3Br | 2003 | no change | 9 | 8-390 ppt | |
| CHCl3 | 2003 | no change | 1 | 4-13 ppt | |
| CH2Cl2 | 1992 | 2003 | 1 | 6-35 ppt | |
| C2Cl4 | 2003 | no change | 8 | 5-14 ppt | |
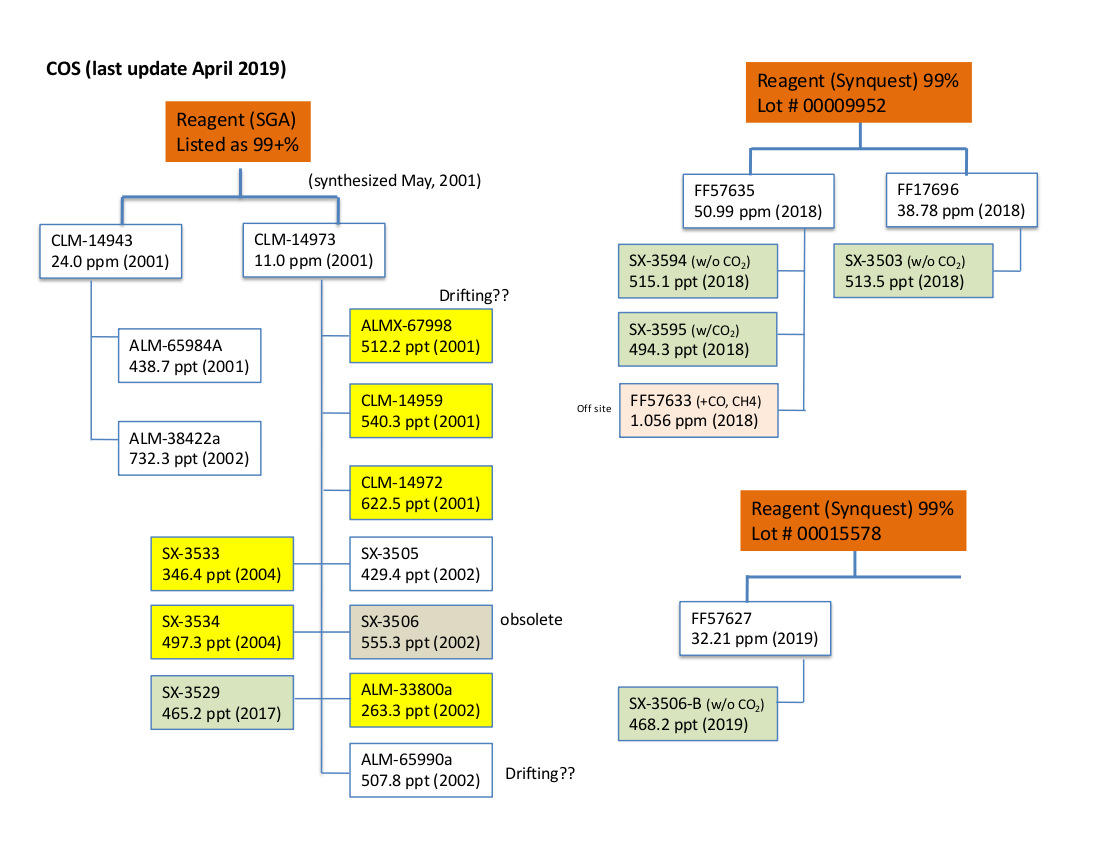
| COS | 2002 | 2004 | 6 | 7 | 260-625 ppt |
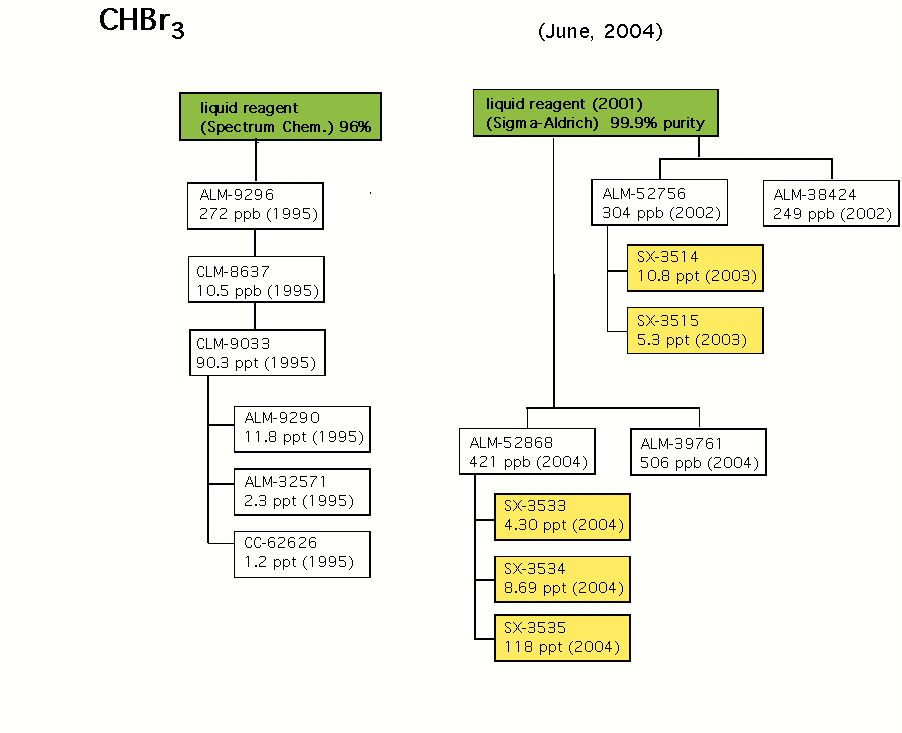
| CHBr3 | 2003 | no change | 2 | 5-11 ppt | |
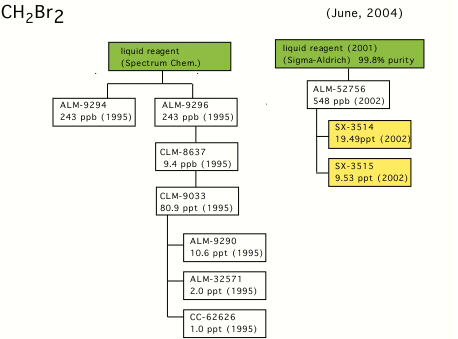
| CH2Br2 | 2003 | 2004 | 7 | 2 | 10-20 ppt |
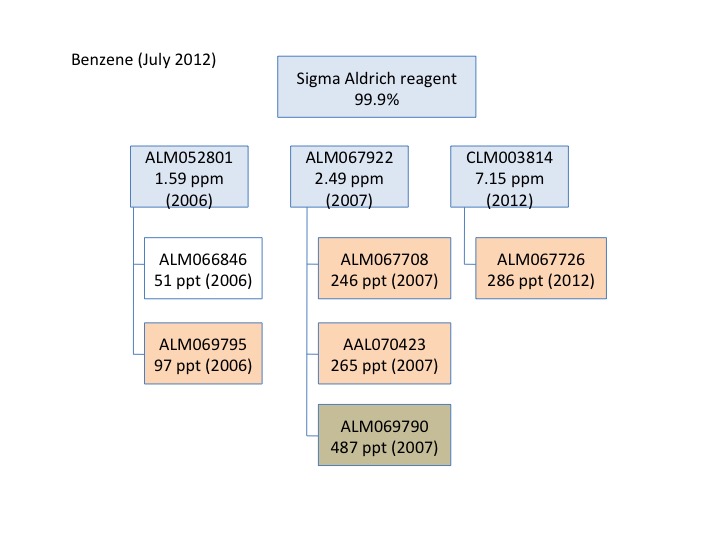
| Benzene | None | 2006 | 2 | 50-100 ppt | |
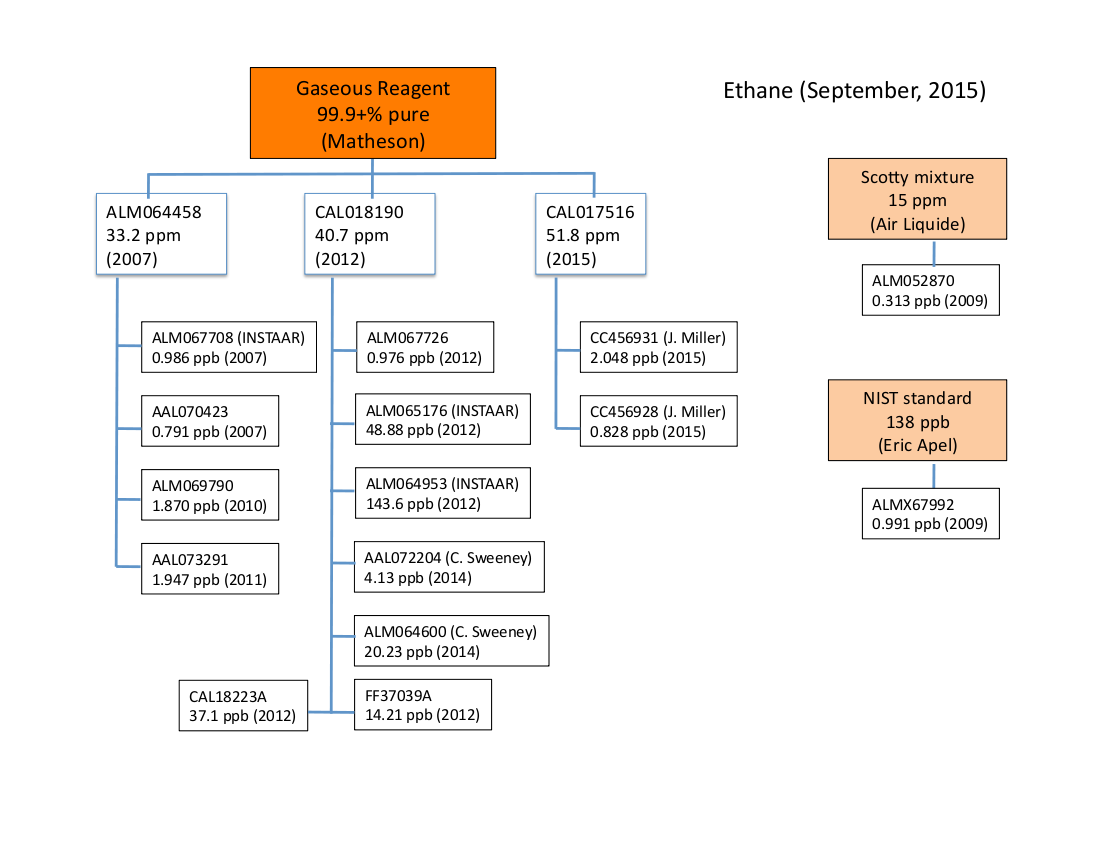
| Ethane | 2007 | 2012 | 6 | 0.5-10 ppb |
Notes
2 - Seven standards prepared from 2001-2004 are now used to define te scale. These seven standards are consistent to within 0.5%. Four standards prepared in 1996 have been removed from the scale. For ECD-based results the conversion in 0.9954 at 95 ppt. For GCMS results the conversion is 0.9853.
3 - The 2006 scale is 1% higher than the 1996 scale. The conversion factor is 1.011.
4 - The 2006 halon-1301 scale is 13% higher than the 1996 scale. The conversion factor is 1.13.
5 - Five standards were added to the four than defined the 1992 scale. The 2006 scale is 0.5% higher than the 1992 scale.: Conversion factor 1.005.
6 - Two Aculife-treated standards were replaced by stainless steel standards in 2004.
7 - The scale change is in name only. The original assigment of 2003 was in error.
References
- Montzka, S.A., J.H. Butler, B.D. Hall, D.J. Mondeel, and J.W. Elkins, 2003, A decline in tropospheric organic bromine, Geophys. Res. Lett., 30(15), 1826, doi:10.1029/2003GL017745.
- Hall, B.D., G.S. Dutton, and J.W. Elkins, (2007), The NOAA nitrous oxide standards scale for atmospheric observations, J. Geophys. Res., vol 112, D09035, doi:10.1029/2006JD007954.