
US Emission Tracker for Potent GHGs
Tracking Emissions over the Contiguous U.S. of Potent Greenhouse Gases Including those Controlled by the Montreal Protocol.
Providing measurement-based estimates of emissions of greenhouse gases and other atmospheric trace gases that impact climate, stratospheric ozone, and air quality over the contiguous United States.
NOAA Global Monitoring Laboratory’s Emission Tracker for potent GHGs provides US emission magnitudes for selected potent greenhouse gases (gases with 100-year global warming potential greater than 150) derived from atmospheric measurements at sites across the U.S. This product offers observation-based emission information to consider alongside U.S. national inventory-based greenhouse gas reporting (EPA, 2022) and for research related to climate, ozone depletion, and air quality. It provides data visualization tools to explore the observation-based estimates of select greenhouse gas emissions on national, regional, and state scales. This effort is an outcome of the joint sampling, measurement, and modeling activities within multiple Divisions of NOAA’s Global Monitoring Laboratory [Hu et al., 2015; 2016; 2017; 2019; CarbonTracker-Lagrange website].
Continental U.S. emissions for SF6.
Emissions updated to 2020 for HFC-32, HFC-125, HFC-134a, and HFC-143a.
This emission estimation project is part of a larger effort to enhance GHG emission estimates using multiple independent methodologies in a manner aligned with the principles of WMO Global Atmosphere Watch Integrated Global Greenhouse Gas Information Systems. The estimates provided here are a representation of results published in Hu et al. (2017) and Hu et al. (2023) and derived using the transport models STILT and HYSPLIT.
HELP: Follow this link for tips on interacting and saving figures on this website.
Figure 1: US emission totals by year for the indicated gas. The best estimate is shown as the dark line, and associated uncertainties are displayed as the shaded band. Uncertainties include contributions from measurements, transport models, the distribution of measurement locations, and estimating upwind background mole fractions.
Figure 2: Emissions totals derived for different regions within the US. See map to see how those regions are specified.
Figure 3: Regional per capita emissions for each region. Values are derived from the annual regional totals (combined method) in Figure 2 after dividing by the population in each region for each year (source: U.S. Census data downloaded from FRED).
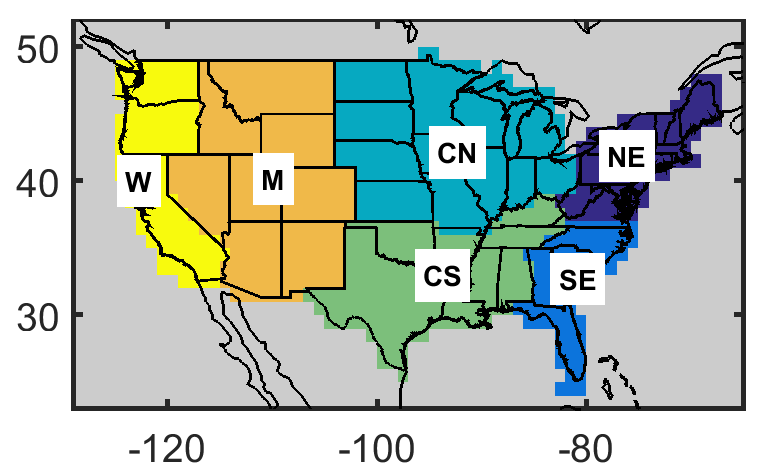 |
Click here for a map defining the emission regions, and the distribution of emission sensitivity provided by the sampling network. |
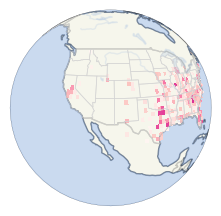
Figure 4: Top-ten emitting states, mean emission during the period indicated. Only mean emissions are shown here because uncertainties associated with the limited number of current measurement locations allow reliable emission estimates for only some states on a year-to-year basis.
Contact information: For questions concerning emissions and inverse modeling methods or access to state or 1° x 1° gridded emission products: Lei Hu (Lei.Hu@noaa.gov); for questions on atmospheric observation data access or availability and measurement methods or standardization: Steve Montzka (Stephen.A.Montzka@noaa.gov) and Isaac Vimont (Isaac.Vimont@noaa.gov); and for website questions or concerns: Geoff Dutton (Geoff.Dutton@noaa.gov).
Acknowledgements: This work is made possible by the efforts of many scientists, engineers, and technicians in NOAA/GML involved with greenhouse gas measurements and their interpretation, including observatory staff at field sites. We want to express our gratitude to Dr. Phil DeCola for his support of this work. This work was also supported, in part, by the NOAA cooperative agreement with the Cooperative Institute for Research in Environmental Sciences, grant number NA17OAR432010. Funding has also been provided by NOAA Climate Program Office’s AC4 program, the Grantham Foundation, and the High Tide Foundation. Support for tower operations in California was provided in part by the California Energy Commission Natural Gas program, the California Air Resources Board, and the U.S. Department of Energy, Biological and Environmental Research Program at Lawrence Berkeley National Laboratory under the U.S. Department of Energy contract DE-AC02-05CH11231.
Citation: Please cite the website and data files contained within as:
- Hu, L., Montzka, S., Vimont, I., Andrews, A., Dutton, G. (2023). US Emission Tracker for Potent GHGs, version 2023. NOAA Global Monitoring Laboratory. https://doi.org/10.15138/ECY2-RX35.