Surprisingly Few Surprises in Global Carbon Cycling
B. Birner1, C. Roedenbeck2, J. Dohner1, A. Schwartzman3 and R. Keeling1
1Scripps Institution of Oceanography, University of California at San Diego, La Jolla, CA 92037; 858-291-2269, E-mail: bbirner@ucsd.edu
2Max Planck Institute (MPI) for Biogeochemistry, Jena, Germany
3University of California at San Diego, La Jolla, CA 92093
Our ability to explain changes in atmospheric CO2 concentration over the last century is limited by interannual to decadal variability in natural carbon sinks. Here we show that it is possible to account for this variability by using a simple quasi-mechanistic model of the land sink with terms that scale with CO2 and with a suitable weighted spatial average of geographically-specific temperature anomalies. This approach reduces the residual global carbon budget imbalance between 1960 and 2020 to ±0.5 GtCyr-1 from the ±0.77 GtCyr-1 obtained using state-of-the-art models. Despite the simple model assuming constant dynamics, the largest improvements occur on decadal timescales, revealing a remarkable stability of the carbon cycle.
The model improves upon purely statistical models by including the known non-linearity in ocean response to rising CO2 caused by carbonate chemistry, following Joos et al. (1996). Biosphere net carbon uptake is represented globally by a linear regression, with the regression model informed by the spatially-varying sensitivity of land carbon fluxes to temperature (Rödenbeck et al, 2018). The model thus can more accurately account for diverging impacts of interannual climate perturbations across different world regions.
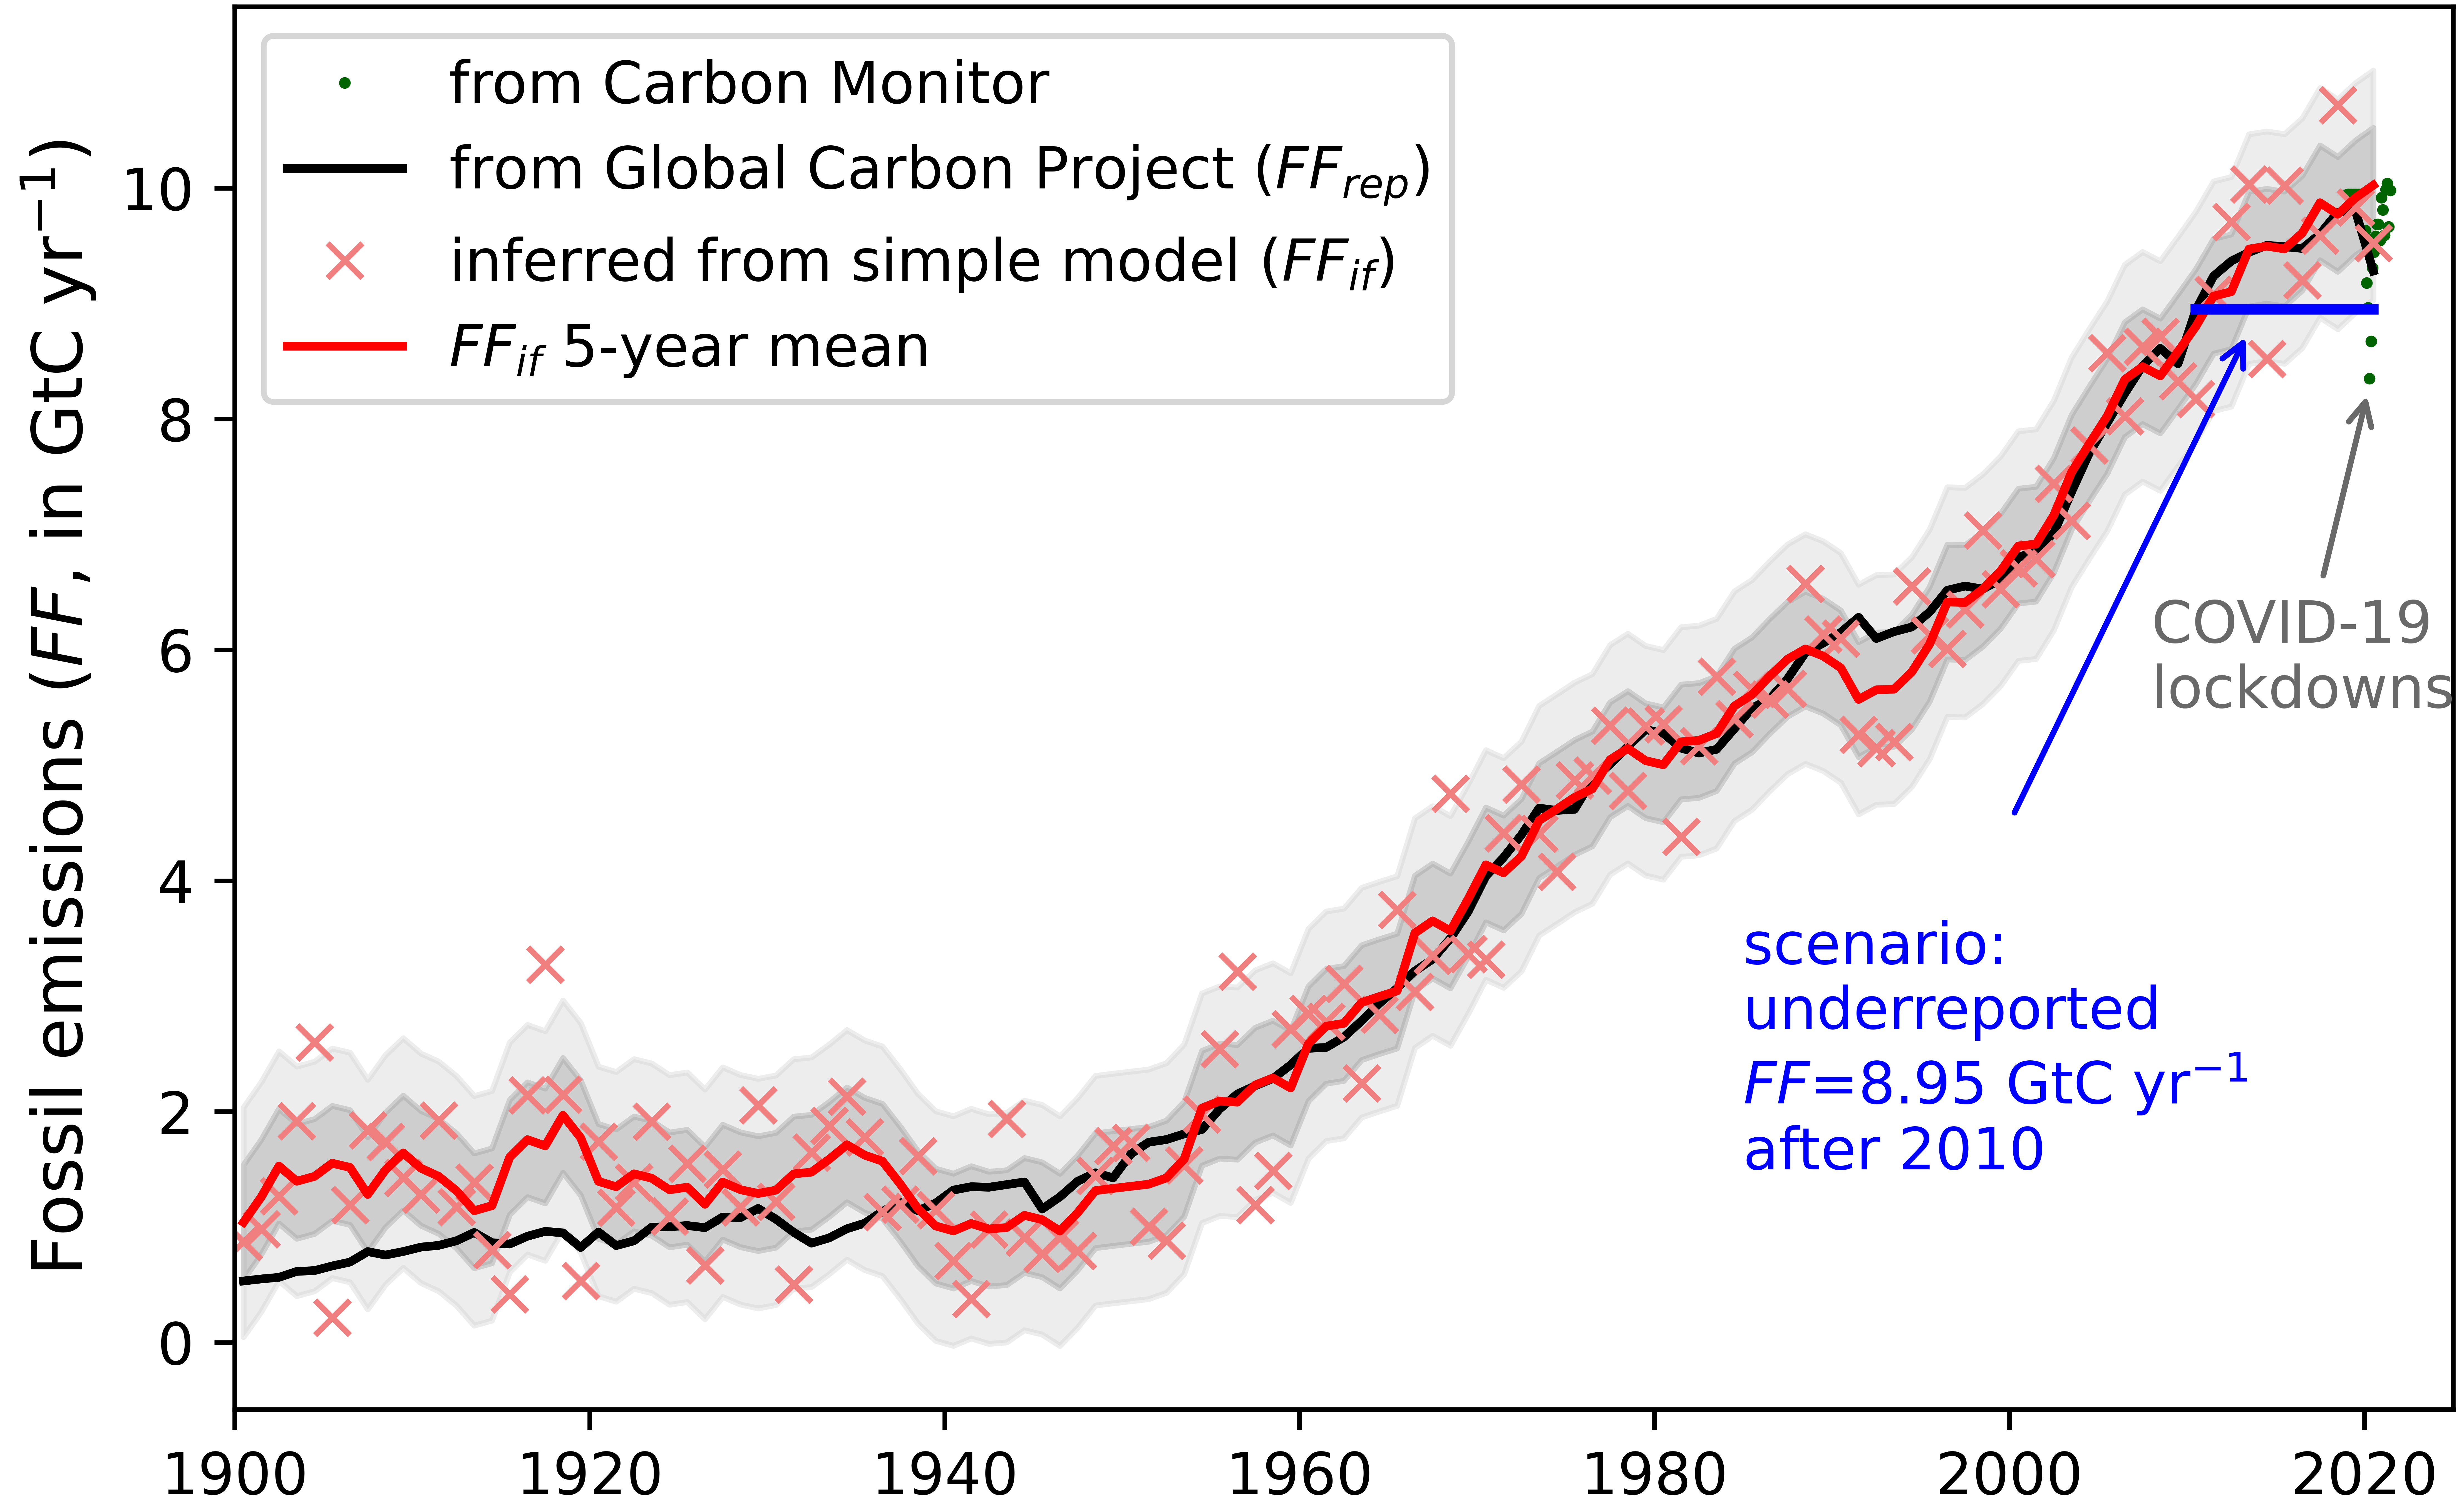
Understanding the true anthropogenic perturbations of the carbon system requires a counterfactual, i.e., a scenario of what would have happened in the absence of human interference or under prescribed emissions. The improved representation of natural variability in biospheric carbon exchange in our model reduces the uncertainty of such a counterfactual and thus allows verifying reported global emissions to within 4.4% (95% confidence level) over the 5-year window of the Paris Agreement, compared to 8.7% in previous work (Peters et al., 2017; Schwartzman & Keeling, 2020).
Figure 1. A comparison of reported emissions (black line) and emissions inferred from a combination of observed atmospheric CO2, a pulse response ocean model and a simple regression model of the land carbon exchange (red crosses and red line). Uncertainty in annual emissions inferred from the model is given by the RMSE and shown as a 1σ and 2σ envelope around the 5-year running mean (dark and light gray envelop). Annual reported emissions are obtained from the Global Carbon Project (Friedlingstein et al., 2021). Beginning in 2020 we also show rescaled monthly emission estimates (green dots) from Carbon Monitor (Liu et al., 2020) to highlight impacts of the COVID-19 pandemic. The solid blue line illustrates a counterfactual scenario of falsely reported constant emissions after year 2010 that will be explored in more detail in the presentation.

