
CarbonWatchNZ: Regional to National Scale Inverse Modelling of New Zealand’s Carbon Balance
B. Bukosa1, S.M. Fletcher1, G. Brailsford1, P. Sperlich1, D. Smale1, E.D. Keller2, J. Turnbull2,3, M. Harvey1, R. Moss1, S. Gray1, S. Moore1, S. Nichol1, M. Kirschbaum4, D. Giltrap4, L. Liáng4 and T. Bromley1
1National Institute of Water and Atmospheric Research (NIWA), Wellington, New Zealand; +64-4-386-0380, E-mail: beata.bukosa@niwa.co.nz
2GNS Science, National Isotope Centre, Lower Hutt, New Zealand
3NOAA Global Monitoring Laboratory (GML), Boulder, CO 80305
4Manaaki Whenua - Landcare Research, Lincoln, New Zealand
Current greenhouse gas reduction strategies rely on CO2 exchange and budget estimates from local to global scale, with a particular focus on regional and national scale carbon accounting. In the CarbonWatchNZ research programme, we use inverse modelling to estimate New Zealand’s carbon uptake and emissions using atmospheric measurements and models. Our decade long (2011-2020) CO2 inversion results (230±52 Tg CO2 yr-1) show a stronger sink relative to prior estimates (116±79 Tg CO2 yr-1). Here, we demonstrate the capability of our inversion system to quantify national scale CO2 fluxes and comprehensively test the sensitivity of our inversion setup to different assumptions.
We tested the sensitivity of our results against the choice of background CO2 values, prior fluxes and transport models (Figure 2), with a special focus on diurnal cycle effects based on an observing system simulation experiment (OSSE). We find that the inversion results are the most sensitive to the choice of the prior terrestrial model. Using updated terrestrial flux estimates of New Zealand’s ecosystems and conditions further increase the posterior CO2 sink. We additionally performed a CO2 diurnal cycle test to identify the impact of using monthly prior terrestrial fluxes that excluded the diurnal variability in CO2 fluxes. The diurnal cycle test points to both under and overestimated posterior fluxes; however, we have not identified a consistent bias in the resulting fluxes.
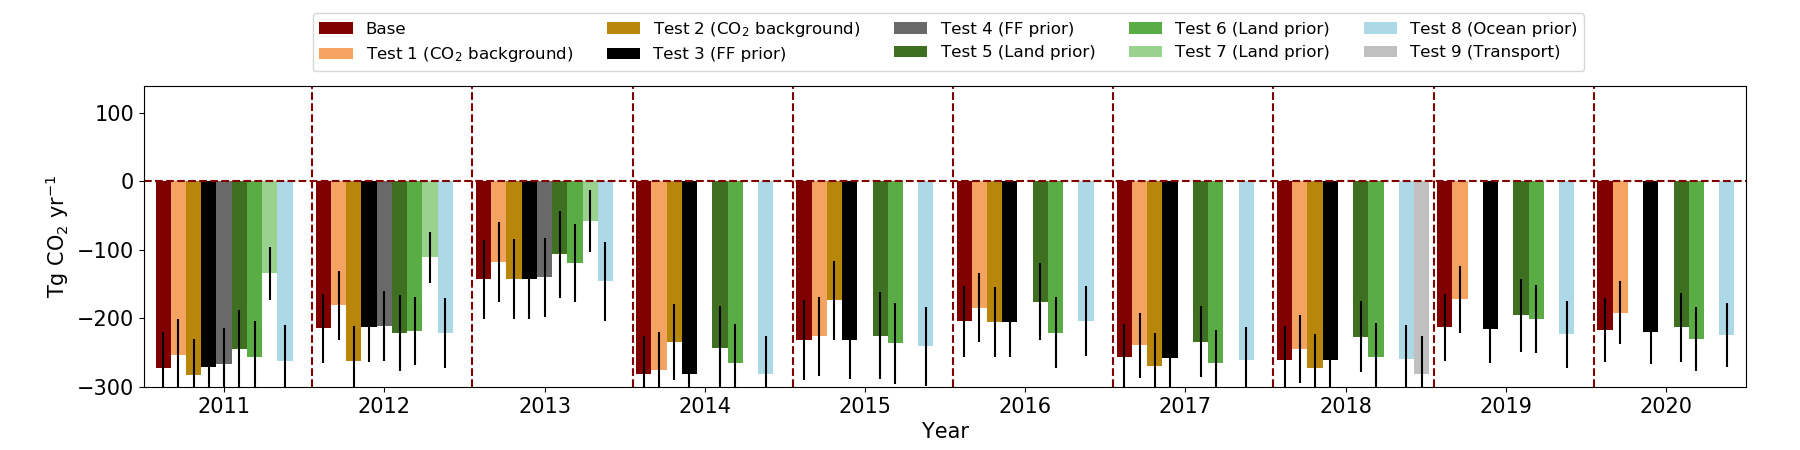
Figure 1. Figure 1. Annual posterior flux estimates from our base inversion and different sensitivity runs based on the choice of background CO2 values (Test 1 and 2), prior fluxes (fossil fuel, land, land-use maps and ocean, Tests 3-8) and transport model (Test 9). The error bars represent the posterior uncertainty. Note, not all tests were performed for the whole inversion time period.