
Increasing CO2 Seasonal Cycle Amplitude in the Arctic Proportional to Rising Atmospheric CO2 Levels
L. Hu1,2, K. Schuldt1, S.A. Montzka2, E. Dlugokencky2, S.E. Michel3, B.H. Vaughn3, K. Thoning2, P.P. Tans2, J.B. Miller2, C. Sweeney2 and A.E. Andrews2
1Cooperative Institute for Research in Environmental Sciences (CIRES), University of Colorado, Boulder, CO 80309; 303-497-5238, E-mail: lei.hu@noaa.gov
2NOAA Global Monitoring Laboratory (GML), Boulder, CO 80305
3Institute of Arctic and Alpine Research (INSTAAR), University of Colorado, Boulder, CO 80309
Atmospheric observations show an enhanced increase of atmospheric CO2 seasonal cycle amplitude (SCA) in the Arctic relative to lower latitudes. This enhancement coincides with intensified temperature increase in the Arctic and rising atmospheric CO2 concentrations globally, both of which were suggested to be important in causing the Arctic CO2 SCA amplification. Here, we present analyses of five-decades of atmospheric CO2 measurements at Barrow, Alaska (BRW) and Mauna Loa Observatory, Hawaii (MLO). At BRW, atmospheric CO2 SCA increased at a rate of 0.602 ± 0.057 % yr-1 between 1971 and 2021, whereas it increased at a rate of 0.226 ± 0.068 % yr-1 at MLO (Fig. 1). However, when normalizing their SCA by annual atmospheric CO2 mole fractions, the trend of CO2 SCA at both sites mostly disappears (Fig. 1), suggesting the SCA trend was likely primarily driven by increasing atmospheric CO2. We also analyzed atmospheric CO2, δ13CO2, and carbonyl sulfide (COS) measurements from 11 long-term Arctic sites and the 4-decades of marine boundary layer reference, which is a smoothed representation of atmospheric CO2 at different latitudes and constructed from atmospheric measurements at remote locations around the globe; results are overall consistent. To better understand the cause for the proportionality between the enhanced CO2 SCA in the Arctic and increasing atmospheric CO2 and to disentangle the regional contributions of fluxes and atmospheric transport to Arctic CO2 SCA amplification, we analyzed NOAA CarbonTracker (CT2019B) posterior fluxes between 2000 and 2018. Global simulations were conducted, where we traced the impact of regional fluxes by source categories (terrestrial CO2 uptake fluxes, fossil fuel emissions, ocean fluxes, and fire emissions) on measured atmospheric CO2 SCA at different sites.
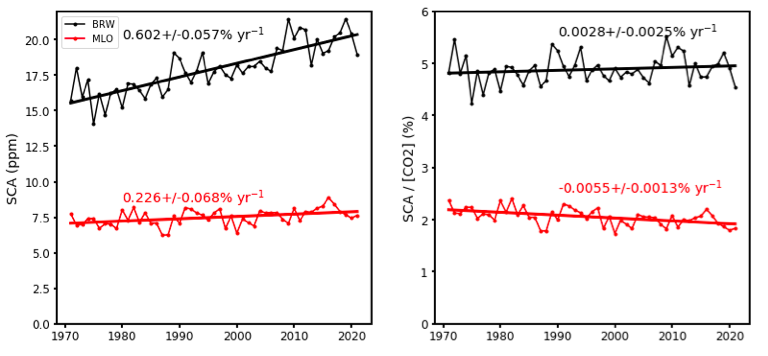
Figure 1. Seasonal cycle amplitude (SCA) of atmospheric CO2 measured at BRW (black) and MLO (red). Left panel: SCA in parts per million (ppm). Right panel: SCA normalized by annual average CO2.