Figure 1. Monthly emissions. The bars in this figure represent carbon
dioxide emissions for each month in
PgC yr
-1 from the specified region.
OCO-2 models simulated three types of surface-to-amosphere exchange of
CO
2, each of which is shown in a different
color: fossil fuel emissions (
tan),
terrestrial biosphere flux possibly including implicit fires (
green), and air-sea gas exchange (
blue).
Negative emissions indicate that the flux removes CO
2 from the atmosphere, and such sinks have bars
that extend below zero. The net surface exchange, computed as the sum
of these three components, is shown as a
thick black line.
- Figure 1a: Prior emissions and their spread.
- Figure 1b: Posterior emissions and their spread for the IS experiment (assimilating traditional in situ measurements)
- Figure 1c: Posterior emissions and their spread for the LN experiment (assimilating OCO-2 retrievals in Land Nadir mode)
- Figure 1d: Posterior emissions and their spread for the LG experiment (assimilating OCO-2 retrievals in Land Glint mode)
In the OCO-2 model intercomparison leading to this Level 4 product
release, bottom-up estimates of fossil fuel were applied directly
without optimization. Inverse modelers were asked to estimate optimal
fluxes from the ocean and land biosphere. This optimization for each
model generally starts with a first guess of the flux component and
its uncertainty. The distribution of prior estimates is shown in panel
1a. The first-guess
fluxes are subsequently evaluated against atmospheric CO2 observations and/or retrievals. These fluxes are then modified to be consistent with
those observational constraints. The optimized results (panels 1b, 1c, and 1d) have
different mean fluxes and uncertainty ranges, indicating the
influence of information brought by the observations.
The bars extend to the across-model mean flux and the error bar
represents one standard deviation of the model suite. The one
standard-deviation level of uncertainty for the land flux is shown
with a thin green vertical line, and the uncertainty for oceanic
exchange is shown with a thin blue vertical line. The net flux as the sum of these three components
uncertainty is shown in black. The uncertainty
on the net flux (black vertical line) is the sum in quadrature of land biosphere
and oceanic flux uncertainties.
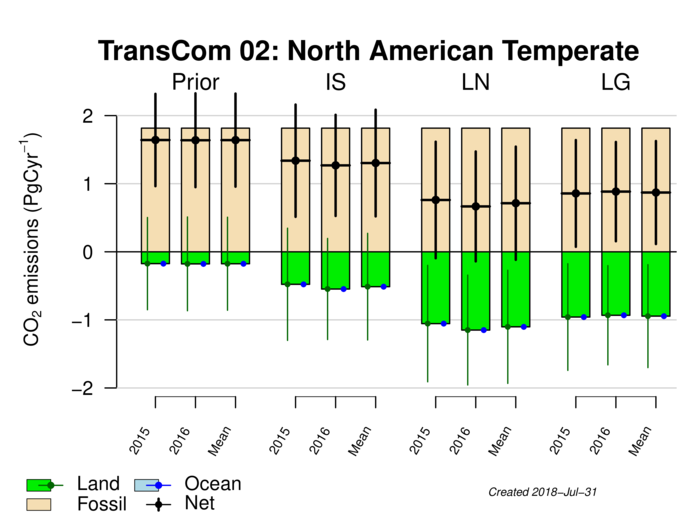 Figure 2. Annual and two-year mean emissions.
 The bars in this figure represent annual-mean carbon
dioxide emissions for 2015 and 2016, and the 2015-2016 mean in
PgC yr
-1 from the specified region. Colors and flux components are as in Figure 1.
The fluxes are arranged in groups by experiment (Prior, IS, LN, LG), as defined in Figure 1.
| Experiment | Year | Fossil Emission | Land | Ocean | Net |
|---|
| Prior | 2015 | 1.82 | -0.17 ± 0.68 | -0.00 ± 0.00 | 1.64 ± 0.68 |
| Prior | 2016 | 1.82 | -0.18 ± 0.69 | -0.00 ± 0.00 | 1.64 ± 0.69 |
| Prior | Mean | 1.82 | -0.18 ± 0.68 | -0.00 ± 0.00 | 1.64 ± 0.68 |
|
| IS | 2015 | 1.82 | -0.48 ± 0.82 | -0.00 ± 0.00 | 1.34 ± 0.82 |
| IS | 2016 | 1.82 | -0.55 ± 0.74 | -0.00 ± 0.00 | 1.27 ± 0.74 |
| IS | Mean | 1.82 | -0.51 ± 0.78 | -0.00 ± 0.00 | 1.30 ± 0.78 |
|
| LN | 2015 | 1.82 | -1.05 ± 0.86 | -0.00 ± 0.00 | 0.76 ± 0.86 |
| LN | 2016 | 1.82 | -1.15 ± 0.81 | -0.00 ± 0.00 | 0.67 ± 0.81 |
| LN | Mean | 1.82 | -1.10 ± 0.83 | -0.00 ± 0.00 | 0.71 ± 0.83 |
|
| LG | 2015 | 1.82 | -0.96 ± 0.78 | -0.00 ± 0.00 | 0.86 ± 0.78 |
| LG | 2016 | 1.82 | -0.93 ± 0.73 | -0.00 ± 0.00 | 0.88 ± 0.73 |
| LG | Mean | 1.82 | -0.95 ± 0.76 | -0.00 ± 0.00 | 0.87 ± 0.76 |
|
Table 1. Annual and two-year mean emissions. Fluxes in
PgC yr
-1 from the specified
region. Annual means for 2015 and 2016 are listed, as well as the
two-year mean, by terrestrial biosphere ("land") air-sea gas exchange
("ocean") and their sum ("net"). The fluxes are arranged in groups by
experiment (Prior, IS, LN, LG), as defined in Figure 1. Uncertainties
are the 1 standard deviation spread in the model ensemble.
