
Caution! This web site represents an older version of the OCO-2 MIP.
The latest version can be found at https://www.gml.noaa.gov/ccgg/OCO2.
| Plot interactions | |
| Zoom - | Click and drag |
| Unzoom - | Double click |
| Pan - | Shift-click and drag |
Barrow Atmospheric Baseline Observatory, United States
| Site Latitude | 71° 19' 22.80" N (71.32300 °N) | |||
| Site Longitude | 156° 36' 41.04" W (-156.61140 °E) | |||
| Site Elevation | 11.0 masl | |||
| Site code | BRW | |||
| Dataset | co2_brw_surface-flask_1_representative_assim (GLOBALVIEW identifier BRW_01D0) | |||
| Assimilated | Yes | |||
| Selection scheme | representative of site | |||
| Data file timestamp | 2021-03-10 20:30:42. | |||
| Data provider | Ed Dlugokencky, NOAA ESRL GMD, 325 Broadway GMD-1, Boulder, CO 80305-3328, United States | |||
| Partner(s) | No partner information available. | |||
| Laboratory |
| |||

Toggle timeseries visibility
Set fixed y-limits on residuals plot
Ymax:
Ymin:
This will disable y axis zooming for the residual plot. To re-enable y axis zooming reload the page.
Ymax:
Ymin:
This will disable y axis zooming for the residual plot. To re-enable y axis zooming reload the page.
(c)
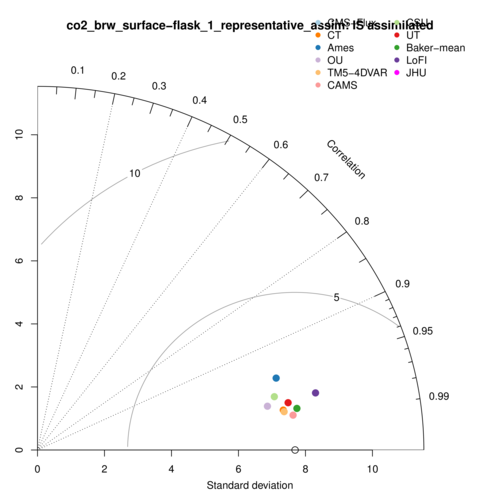
(c) Taylor diagram for this dataset.
| model | time | note |
|---|---|---|
| CT | 2021-10-12 21:18:23 UTC | |
| OU | 2021-11-05 22:29:53 UTC | OG results delivered 5 Nov 2021 |
| TM5-4DVAR | 2021-10-19 19:13:40 UTC | initial submission |
| CAMS | 2021-09-06 20:34:34 UTC | updated 7 Sep 2021 with MDMs for withheld obs |
| Ames | ||
| CMS-Flux | ||
| CSU | 2021-10-14 14:20:43 UTC | first submission |
| UT | 2021-10-16 14:08:45 UTC | initial submission |
| Baker-mean | 2021-10-14 17:58:59 UTC | |
| WOMBAT | 2021-10-01 02:45:42 UTC | first submission |