
Flux Histograms (CarbonTracker-CH4)
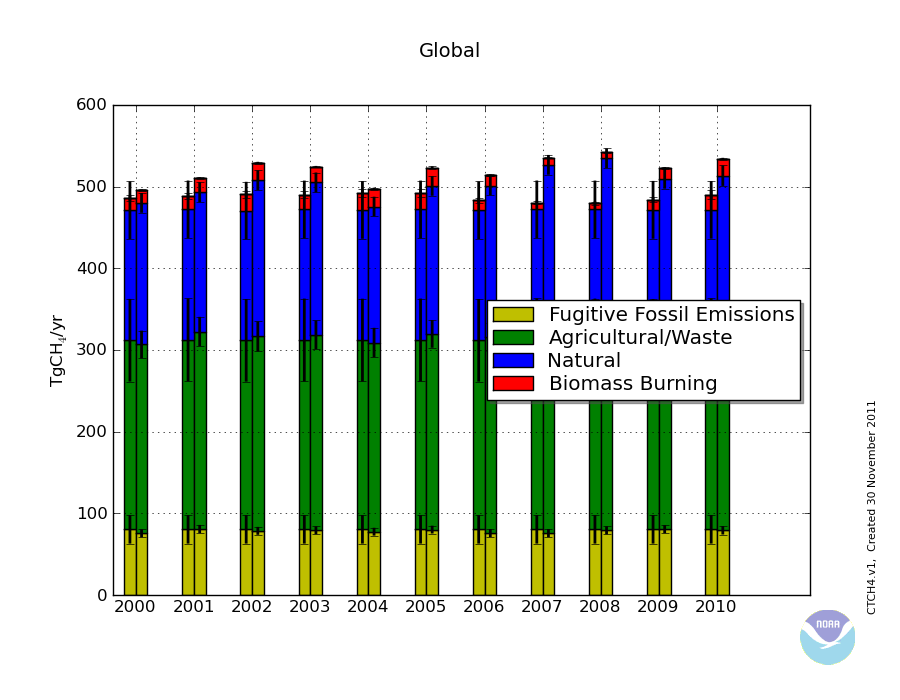
The contribution to the total CH4 flux from each category of emissions with error bars. For each pair of histogram bars, the prior flux estimates are shown on the left and the post-assimilation estimates on the right. Note that, except for emissions from fires, the prior flux estimates are constant for each year. The units are TgCH4/yr.
| Year | Total | Fossil Fuel |
Agriculture Waste |
Natural | Biomass Burning |
|---|---|---|---|---|---|
| 2000 | 486.1 ± 64.1 495.7 ± 21.4 |
80.3 ± 17.4 75.5 ± 4.8 |
231.6 ± 50.6 231.3 ± 16.9 |
159.2 ± 35.2 173.4 ± 12.1 |
14.9 ± 3.3 15.6 ± 0.8 |
| 2001 | 488.7 ± 64.3 510.5 ± 22.4 |
80.3 ± 17.4 80.8 ± 5.0 |
232.1 ± 50.7 241.8 ± 18.0 |
159.7 ± 35.4 170.6 ± 12.3 |
16.5 ± 3.7 17.3 ± 1.0 |
| 2002 | 490.6 ± 64.2 529.3 ± 22.5 |
80.3 ± 17.4 78.6 ± 4.8 |
231.5 ± 50.6 238.0 ± 18.3 |
158.9 ± 35.2 191.3 ± 12.0 |
19.9 ± 4.6 21.4 ± 1.1 |
| 2003 | 490.3 ± 64.3 524.5 ± 21.9 |
80.3 ± 17.4 79.2 ± 4.8 |
232.0 ± 50.7 239.4 ± 17.6 |
159.8 ± 35.4 186.6 ± 12.2 |
18.3 ± 4.1 19.3 ± 1.0 |
| 2004 | 491.7 ± 64.3 497.5 ± 22.2 |
80.3 ± 17.4 77.5 ± 4.8 |
231.8 ± 50.6 231.6 ± 18.0 |
159.3 ± 35.2 166.5 ± 12.0 |
20.3 ± 4.8 21.8 ± 1.3 |
| 2005 | 492.6 ± 64.4 523.5 ± 21.3 |
80.3 ± 17.4 80.1 ± 4.8 |
232.0 ± 50.7 239.7 ± 16.9 |
159.8 ± 35.3 181.1 ± 11.9 |
20.5 ± 5.0 22.6 ± 1.4 |
| 2006 | 483.3 ± 64.1 513.9 ± 21.4 |
80.3 ± 17.4 75.8 ± 4.9 |
231.6 ± 50.6 239.7 ± 17.0 |
159.3 ± 35.2 185.9 ± 11.9 |
12.1 ± 3.1 12.5 ± 1.1 |
| 2007 | 480.5 ± 64.3 535.4 ± 21.8 |
80.3 ± 17.4 75.8 ± 4.9 |
232.1 ± 50.7 255.4 ± 17.4 |
159.7 ± 35.4 195.6 ± 12.1 |
8.4 ± 2.1 8.6 ± 0.7 |
| 2008 | 479.9 ± 64.2 542.3 ± 22.0 |
80.3 ± 17.4 79.2 ± 4.9 |
232.0 ± 50.7 255.5 ± 17.7 |
159.8 ± 35.4 200.1 ± 12.1 |
7.8 ± 1.9 7.5 ± 0.6 |
| 2009 | 484.3 ± 64.2 523.1 ± 22.0 |
80.3 ± 17.4 80.5 ± 4.9 |
231.6 ± 50.6 238.5 ± 17.6 |
159.8 ± 35.4 190.8 ± 12.3 |
12.6 ± 3.1 13.2 ± 0.7 |
| 2010 | 490.3 ± 64.4 533.9 ± 22.8 |
80.3 ± 17.4 79.2 ± 5.1 |
232.2 ± 50.7 246.8 ± 18.3 |
159.1 ± 35.2 187.4 ± 12.5 |
18.7 ± 5.2 20.4 ± 1.5 |
Prior and post-assimilation flux estimates corresponding the above histogram. Red numbers are prior flux estimates and uncertainties, and blue numbers are post-assimilation flux estimates and uncertainties. Units are TgCH4/yr.

Contribution of each category of source processes to the estimated flux anomalies, along with error bars showing the estimated flux anomaly uncertainties. Flux anomalies are calculated by subtraction of long-term monthly means over the assimilation period. Units are TgCH4/yr.
| Year | Total | Fossil Fuel |
Agriculture Waste |
Natural | Biomass Burning |
|---|---|---|---|---|---|
| 2000 | -29.5 ± 22.8 | -1.4 ± 4.4 | -13.5 ± 18.5 | -14.0 ± 12.5 | -0.5 ± 1.0 |
| 2001 | -14.2 ± 23.7 | 1.8 ± 4.5 | -0.6 ± 19.5 | -16.5 ± 12.7 | 1.2 ± 1.1 |
| 2002 | 4.1 ± 23.9 | -2.2 ± 4.4 | -4.7 ± 19.8 | 5.7 ± 12.6 | 5.2 ± 1.2 |
| 2003 | 4.2 ± 23.4 | 0.5 ± 4.4 | -1.5 ± 19.2 | 2.0 ± 12.5 | 3.2 ± 1.1 |
| 2004 | -22.8 ± 23.6 | -0.4 ± 4.4 | -10.3 ± 19.4 | -17.7 ± 12.5 | 5.7 ± 1.4 |
| 2005 | 1.8 ± 23.0 | 0.0 ± 4.4 | 0.1 ± 18.7 | -4.8 ± 12.5 | 6.5 ± 1.6 |
| 2006 | -8.4 ± 22.9 | -1.6 ± 4.5 | -2.4 ± 18.6 | -1.0 ± 12.5 | -3.4 ± 1.3 |
| 2007 | 11.5 ± 23.2 | -2.4 ± 4.5 | 9.4 ± 19.0 | 11.8 ± 12.5 | -7.3 ± 1.0 |
| 2008 | 19.5 ± 23.4 | 1.3 ± 4.5 | 12.5 ± 19.3 | 14.0 ± 12.5 | -8.3 ± 0.9 |
| 2009 | 4.2 ± 23.5 | 3.0 ± 4.5 | -2.3 ± 19.2 | 6.4 ± 12.8 | -2.8 ± 0.9 |
| 2010 | 20.5 ± 24.2 | 2.3 ± 4.7 | 8.2 ± 19.8 | 5.7 ± 13.0 | 4.2 ± 1.6 |
Estimated flux anomalies and uncertainties by source process category corresponding the flux anomaly histogram shown above. Flux anomalies are calculated by subtraction of long-term monthly means over the assimilation period. Units are TgCH4/yr.