
CarbonTracker-CH4 web products include the following key components:
Flux Maps
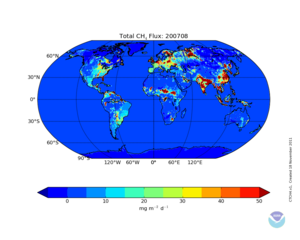
These pages give access to maps illustrating the estimated natural and anthropogenic CH4 surface exchange. Total fluxes for each latitude are also shown. Pull-down menus allow selection of annual, monthly or seasonal maps. In addition to the estimated fluxes, maps of deviations from prior flux estimates and anomalies over the entire simulation are also available. The user may also select maps by emission process.
Flux Time Series
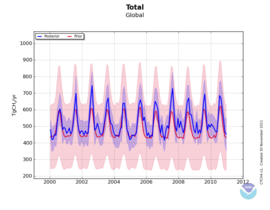
The figures on these pages show the evolution of natural and anthropogenic CH4 surface exchange over time. The user may select the entire time period, a single month, year, or a particular season as well as a particular emission category. Flux time series are available for a number of spatially aggregated regions as well as the those defined for the TransCom intercomparison project. Anomaly time series are also shown, and tables provide values shown in the figures.
Flux Histograms

The figures on these pages show histograms summarizing the natural and anthropogenic CH4 surface exchange. The user may select the entire time period, a single month, year, or a particular season. Tables provide values shown in the figures.