
This is not the latest CarbonTracker update!
Link to latest.
CarbonTracker Observational Network
Click on any site marker for more information.
CH4Time Series
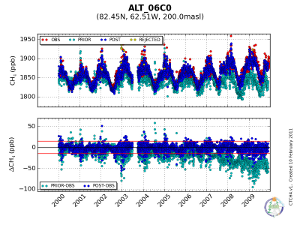
Plots of time series of CH4 mole fractions, prior, post-assimilation and observed, at the CarbonTracker observation sites, and histograms of residuals at the sites for selected periods (residuals are the difference between the post-assimilation and measured mole fractions).
Aircraft Profiles
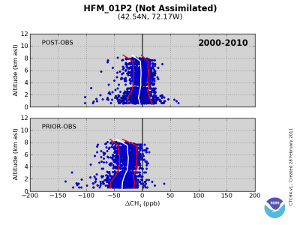
Plots include residuals (simulated - observed) for aircraft profiles at the observation sites, shown as a function of date and sample elevation. and statistical summaries of residuals for aircraft profiles at the observation sites, shown as a function of season and elevation.
Additional Observation Data
- NOAA's Interactive Atmospheric Data Visualization
- Documentation on observations, including tabular list of sites and CarbonTracker statistical performance at each site.