
The U.S. government is closed. This site will not be updated; however, NOAA websites and social media channels necessary to protect lives and property will be maintained.
To learn more, visit commerce.gov.
For the latest forecasts and critical weather information, visit weather.gov.
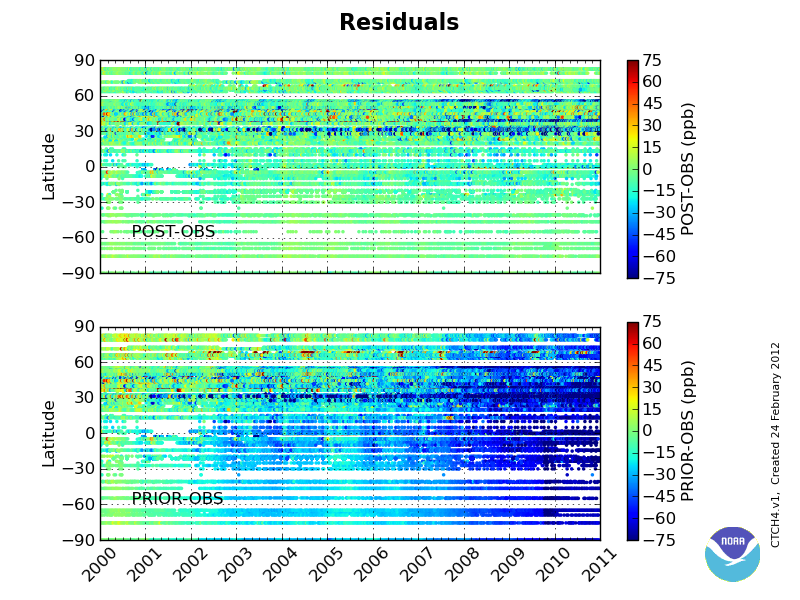
Summary of CarbonTracker-CH4 residuals. CarbonTracker posterior residuals (simulated minus observed, in nmol mol-1) as a function of time and latitude (top). Each dot represents the time and location of a CH4 observation that was assimilated in CarbonTracker. Colors represent the difference between the final simulated value and the actual measurement, with warm colors indicating that CarbonTracker simulates too much methane compared to observations, and cool colors indicating that CarbonTracker estimates too little. The bottom figure shows the residuals that would be obtained without assimilation of observations.
Please see CH4 Time Series for residuals of individual sites.