
CT2022
Home NOAA GHG Trackers FAQ Documentation Tutorial Collaborators VersionsResults
Evaluation Fluxes Observations Mole Fractions DownloadResources
How to Cite E-mail List Contact Us CT on YouTube Glossary References Bibliography
| Plot interactions | |
| Zoom - | Click and drag |
| Unzoom - | Double click |
| Pan - | Shift-click and drag |
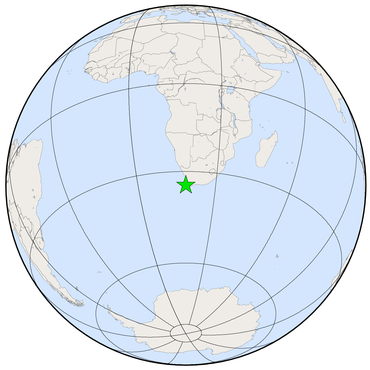
Cape Point, South Africa
| Site Latitude | 34° 21' 8.28" S (-34.35230 °N) | |||
| Site Longitude | 18° 29' 20.76" E (18.48910 °E) | |||
| Site Elevation | 230.0 masl | |||
| Site code | CPT | |||
| Dataset | co2_cpt_surface-flask_1_representative (GLOBALVIEW identifier CPT_01D0) | |||
| Assimilated | Yes, but showing unassimilated subset Switch to assimilated subset | |||
| Selection scheme | representative of site | |||
| Data provider | Ed Dlugokencky, NOAA GML, 325 Broadway R/GML-1, Boulder, CO 80305-3328, United States | |||
| Partner(s) | Casper Labuschagne, Cape Point GAW Station, Climate and Environment Research & Monitoring (CERM), South Africa, and South African Weather Service, South Africa | |||
| Laboratory |
| |||
| Download these data via ObsPack. | ||||

(a) Time series of CO2 mole fractions, both simulated and observed, at this CarbonTracker observation site. In the top panel, measured mole fractions (open black circles) are plotted along with CarbonTracker simulated values (filled light blue circles).
(b) The time series of model residuals--the difference between the simulated and measured mole fractions--shown with dark green filled circles. These residuals should be uncorrelated in time, unbiased (i.e., have a mean of zero), and distributed normally.
(c) Summary statistics for model residuals from to . Residuals are defined as simluated values minus observed values. "Bias" is the mean of the residuals; "std. dev." is the standard deviation, and RMSE is root-mean-square error. All quantities are in ppm of CO2. The time period over which these quantities are computed is set by the graphs (a) and (b).
(d) Seasonal histograms of residuals
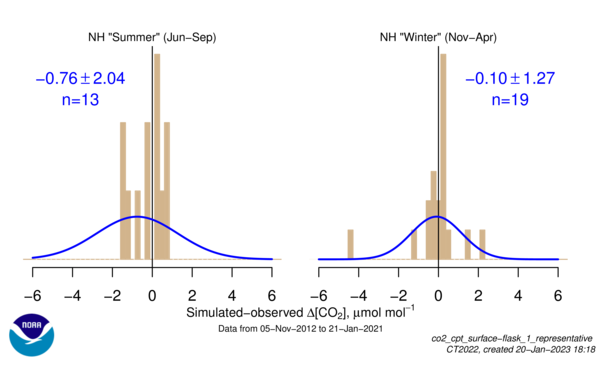
(d) Seasonal histograms of the residuals for this dataset. See caption for top figure for the definition of residuals. The left panel collects all residuals for each northern hemisphere summer (June through September); the right panel is the northern hemisphere winter (November through April). Residuals before 1 Jan 2001 are excluded from this analysis to avoid an effect of CarbonTracker burn-in from a poorly-known initial CO2 distribution. The tan color shows the histogram of the residuals themselves; the blue lines and statistics shown in blue text are a summary of the residuals interpreted as a normal distribution. The vertical scales are relative, determined by the number of observations and how tightly they are grouped, with the area under the histogram forced to unity.