The Technical Details: The Bomb Spike
Nuclear Testing and Its Own Fingerprint
Beginning in the 1940s, the United States and other countries began atmospheric nuclear weapons testing. This produced many unusual isotopes in the atmosphere, and 14C was one of them. At first, in the 1950s only a few tests were done, but as more, and larger tests were done, scientists realized how dangerous this was. This caused the nuclear powers to sign a Nuclear Test Ban Treaty, which went into effect in October 1963.
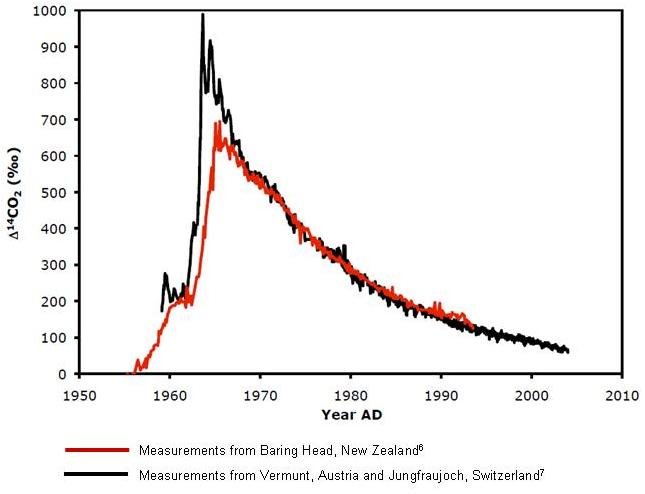
The graph below shows how the ratio of 14CO2 to total CO2 rapidly increased in the atmosphere–can you pick out series of nuclear tests in the late 1950s? The last tests were just before the treaty went into effect in late 1963, when the highest 14C levels are seen. The decrease since then is not due to radioactive decay, but mostly due to the exchange of CO2 (containing the high levels of 14C) with the ocean, as well as with land biota. Scientists use this graph to help understand how quickly atmospheric CO2 flows in and out of the oceans and terrestrial ecosystems.

The Southern Hemisphere measurements, from Baring Head, just near Wellington, New Zealand, look quite different to the measurements from the Northern Hemisphere. The peak of the “bomb spike” is much lower–and it occurs later. This is because the atmospheric nuclear weapons tests were done in the Northern Hemisphere, and the biggest ones were done in the Russian Arctic. It takes about a year for air to mix from the Northern Hemisphere into the Southern Hemisphere, so the peak occurs about a year later in the south, and it is smaller, because, during that year, some of the 14C had already been absorbed into the oceans.
By the 1980s, most of the “bomb” 14C had been absorbed into the oceans and land biota, leaving slightly elevated levels in the atmosphere. Yet atmospheric 14C levels continue to decrease–now because of CO2 emissions from fossil fuel burning. Fossil fuels are millions of years old, and have zero 14C.
