
Information
Home FAQ Project Goals Documentation Collaborators TutorialResults
Fluxes Observations Evaluation Visualization DownloadGet Involved
Suggestions E-mail List Contact UsResources
How to Cite Version History Glossary References Bibliography
| Plot interactions | |
| Zoom - | Click and drag |
| Unzoom - | Double click |
| Pan - | Shift-click and drag |
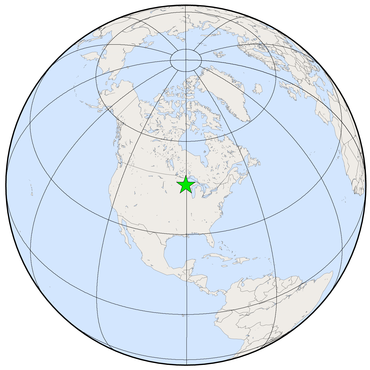
Park Falls, Wisconsin, United States
| Site Latitude | 45° 56' 42.36" N (45.94510 °N) | |||||
| Site Longitude | 90° 16' 23.52" W (-90.27320 °E) | |||||
| Site Elevation | 472.0 masl | |||||
| Site code | LEF | |||||
| Dataset | ch4_lef_tower-insitu_1_allvalid-396magl | |||||
| Assimilated | Yes Switch to unassimilated subset | |||||
| Data provider | Arlyn Andrews, NOAA GML, 325 Broadway R/GML-1, Boulder, CO 80305-3328, United States, and Ankur Desai, United States | |||||
| Partner(s) | Dan Baumann, United States | |||||
| Laboratory |
| |||||


(a) Time series of CH4 mole fractions, both observed and simulated, at this CarbonTracker-CH4 observation site. The measured mole fractions (black circles) are plotted along with CarbonTracker-CH4 simulated values with prior fluxes (dark green circles), posterior-assimilated fluxes (blue circles), and posterior-withheld fluxes (yellow circles).
(b) The time series of model residuals, the difference between the measured and simulated mole fractions, for simulation with prior fluxes (dark green circles), posterior-assimilated fluxes (blue circles), and posterior-withheld fluxes (yellow circles).
(c) Summary statistics for model residuals from to . Residuals are defined as observed values minus simulated values. "Bias" is the mean of the residuals; "std. dev." is the standard deviation, and RMSE is root-mean-square error. All quantities are in ppb of CH4. The time period over which these quantities are computed is set by the graphs (a) and (b).
(d) Seasonal histograms of residuals

(d) Seasonal histograms of the residuals for this dataset. See caption for top figure for the definition of residuals. The left panel collects all residuals for each northern hemisphere summer (June through September); the right panel is the northern hemisphere winter (November through April). The tan color shows the histogram of the residuals themselves; the blue lines and statistics shown in blue text are a summary of the residuals interpreted as a normal distribution. For this assimilated dataset, the assumed model-data mismatch averaged over the seasonal span is shown in green (lines and text). The vertical scales are relative, determined by the number of observations and how tightly they are grouped, with the area under the histogram forced to unity.