Information
Home FAQ Project Goals Documentation Collaborators TutorialResults
Fluxes Observations Evaluation Visualization DownloadGet Involved
Suggestions E-mail List Contact UsResources
How to Cite Version History Glossary References BibliographyCarbonTracker-CH4 is the first release of NOAA's combined CH4 measurements and modeling system. This system provides global estimates of methane emissions as well as the effect of sinks (removal from the astmosphere) in the atmosphere. This is accomplished using atmospheric CH4 observations from the NOAA Cooperative Global Air Sampling Network and collaborators. Atmospheric CH4 distributions that are optimally consistent with network observations are also produced and are available for download. CarbonTracker-CH4 2012 covers the period 2000 through 2010. This document provides brief discussions of the observations and assimilation system, as well as highlights of results.
The CarbonTracker observing system (Methane)
CarbonTracker-CH4 surface flux estimates are optimally consistent with measurements of ~46,500 discrete air samples from 88 sites across the world. ~15,000 of these are four-hourly averages from towers in Canada measured by Environment Canada.
Global CH4 Fluxes
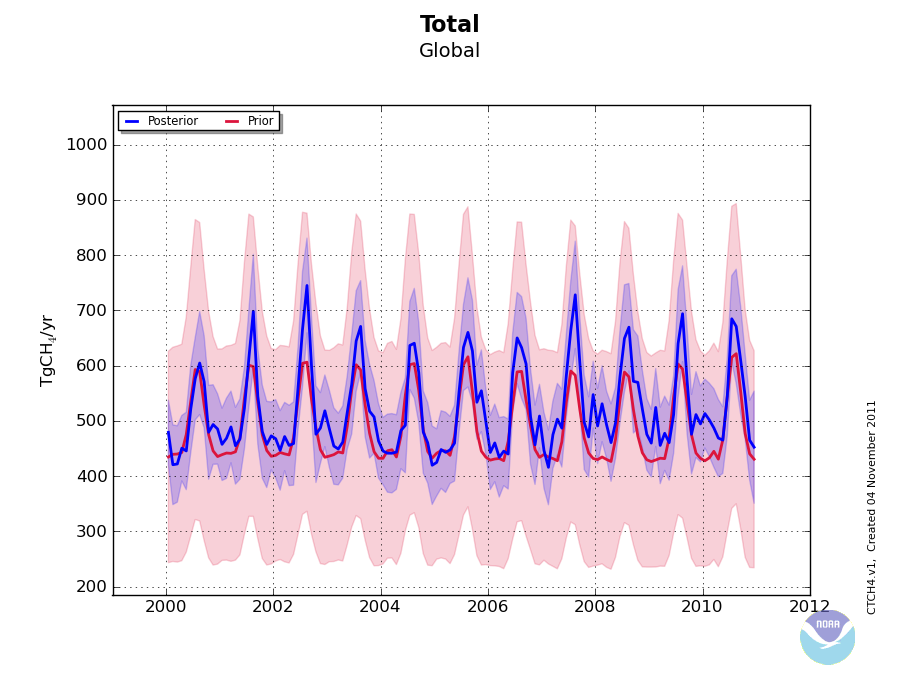
The plot above shows the total emissions from all methane sources and the soil sink added up over the entire globe. The prior flux estimates and uncertainty bounds are shown as a red curve with light red shading, and the posterior flux estimates and uncertainty bounds are shown as a blue curve with light blue shading. Global emissions are largest during the Northern Hemisphere's summer due to terrestrial methane sources and the greater landmass of the Northern Hemisphere. Also, many sources of methane are microbial and are most productive during the warm season. It is important to note that the width of the posterior uncertainty bounds is significantly smaller compared to that of the prior uncertainties, and this is due to the addition of information coming from the observations. The posterior flux estimates show considerable variability from year to year, and this is driven by the observed methane variability. As discussed by Dlugokencky et al. (2009), the growth rate of the atmospheric burden of methane increased markedly during 2007. This feature is captured by CarbonTracker-CH4. Note also that global emission of methane has been relatively large since about 2006 (see the estimated global flux anomaly).
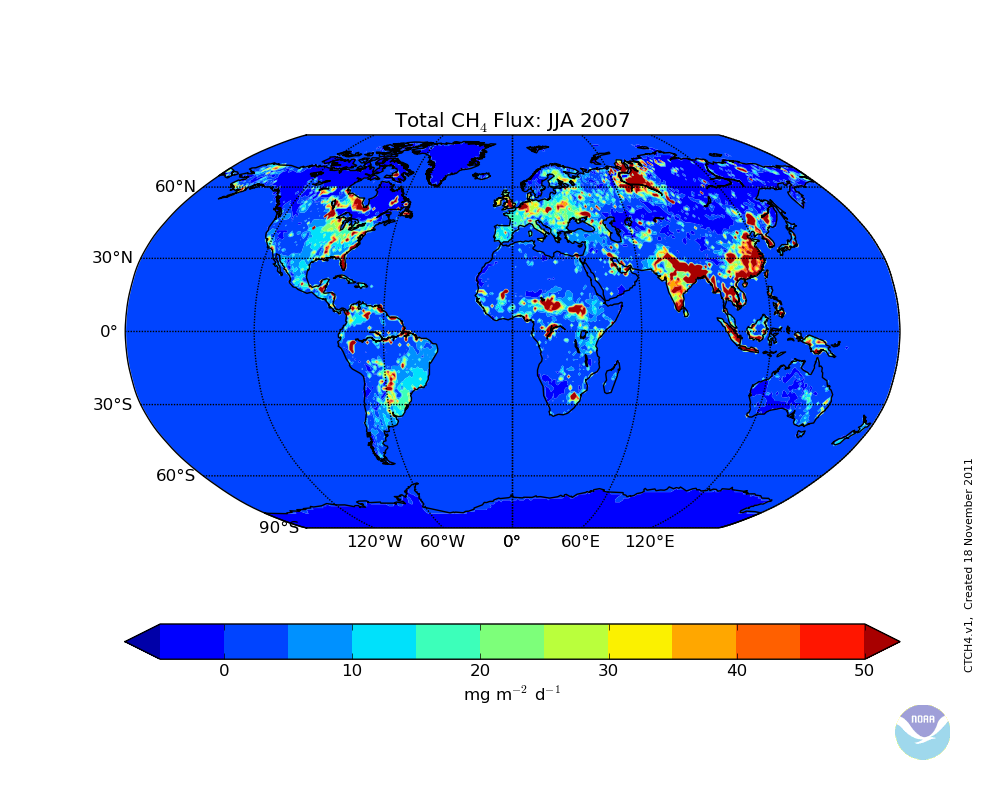
The global map shows the estimated distribution of methane emissions during the Northern Hemisphere in 2007 (accompanying uncertainty map), a period during which methane fluxes were anomalously high. Large emissions are seen over wetland regions of Western Siberia and other High Northern wetland regions. In some regions of the tropics, emissions from the wetlands were also high during this period, especially for Tropical Asia. Note that estimated anthropogenic emissions are large over South East Asia and India, as well as North Western Europe (see maps for individual processes).
North American CH4 Fluxes
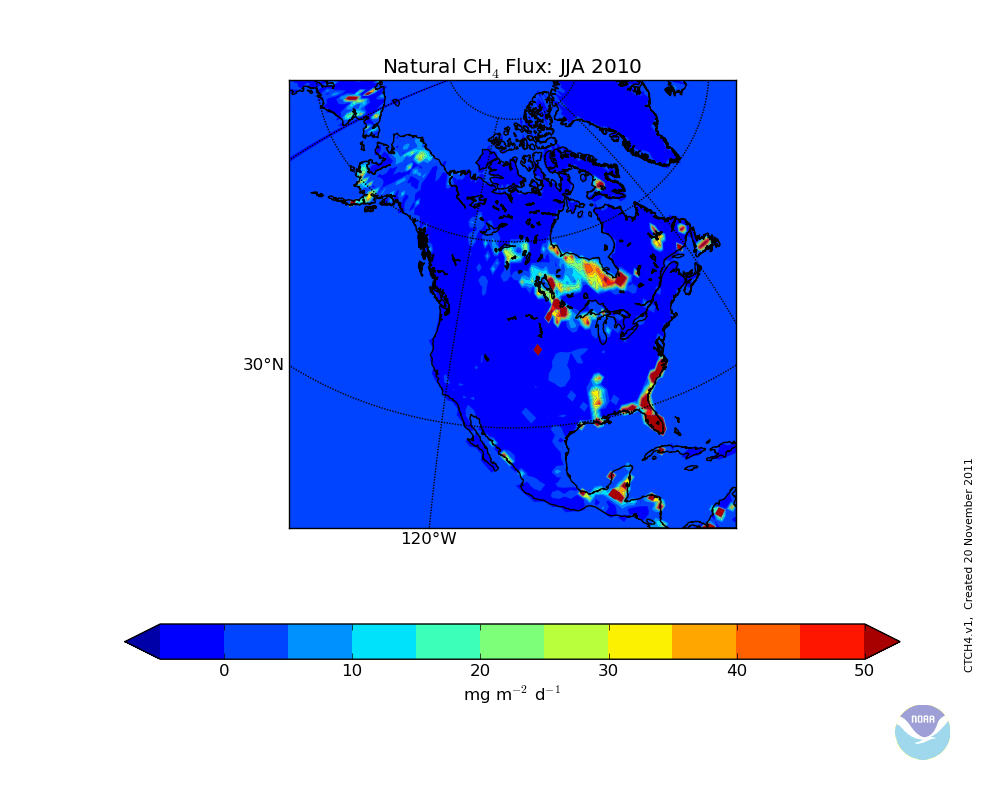
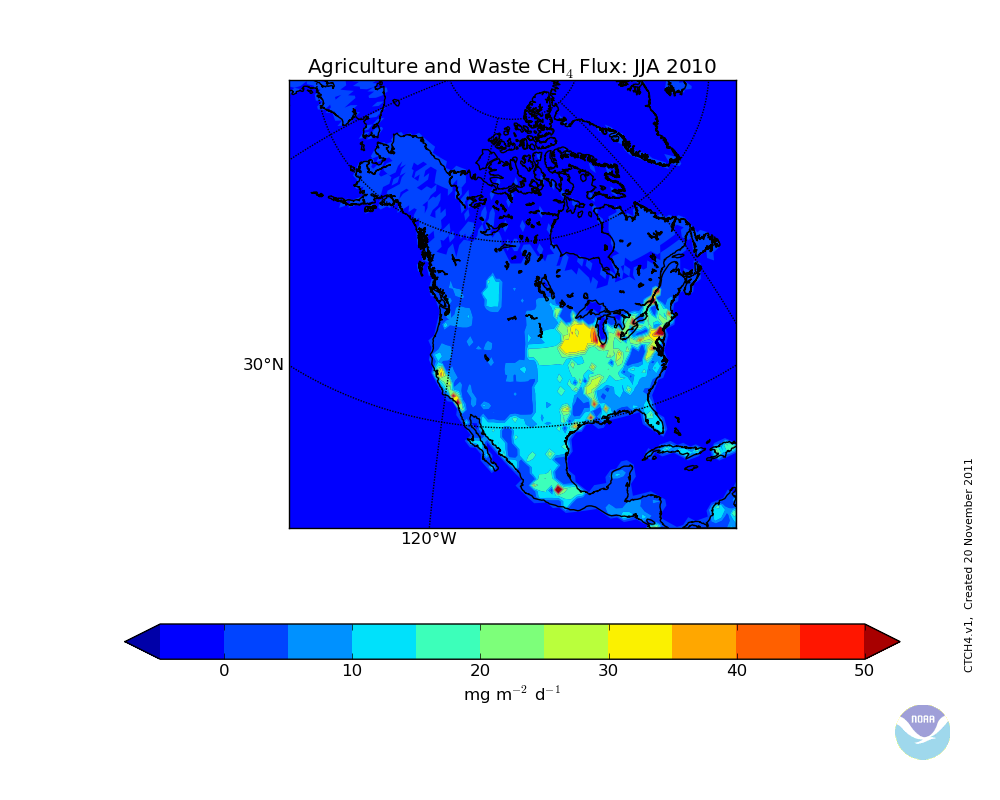
Emissions from North America are relatively small on a global scale (~50 TgCH4/yr compared to ~520 TgCH4/yr globally). The largest source of methane for North America is due to processes associated with agriculture and waste followed by natural sources (mostly wetland emissions). The figures below show estimated methane fluxes for the summer of 2010. Methane emissions due to agriculture and waste are highest near large urban areas and productive agricultural regions, such as the upper Midwest. The dominant locations of wetland emissions are in the Southeast, especially Florida and along the southern Mississippi River basin. Boreal and High-Latitude wetlands are found along the Hudson Bay, Northern Minnesota/Wisconsin and Alaska.
Northern Polar Fluxes
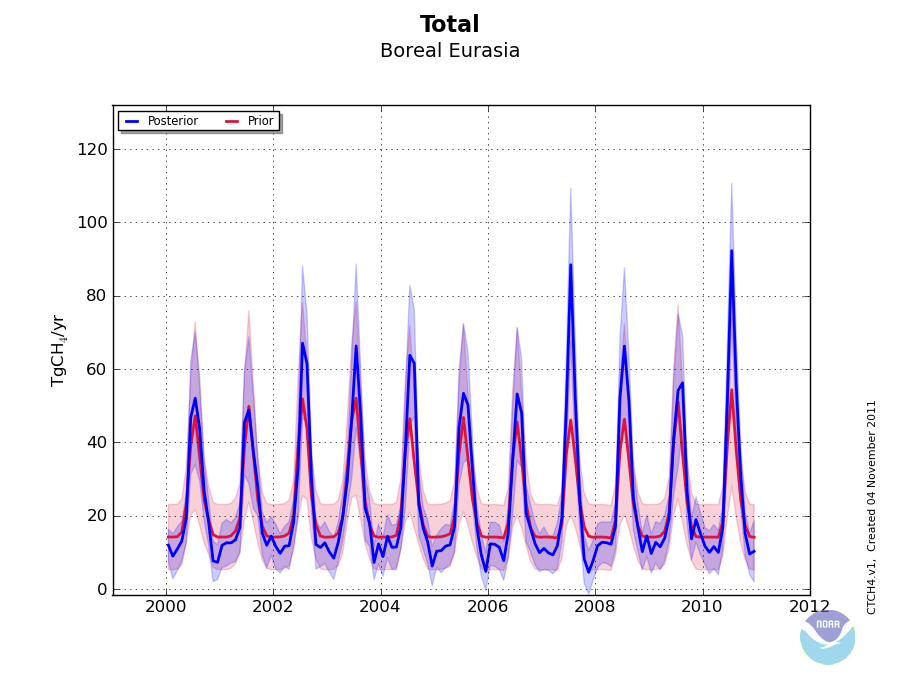
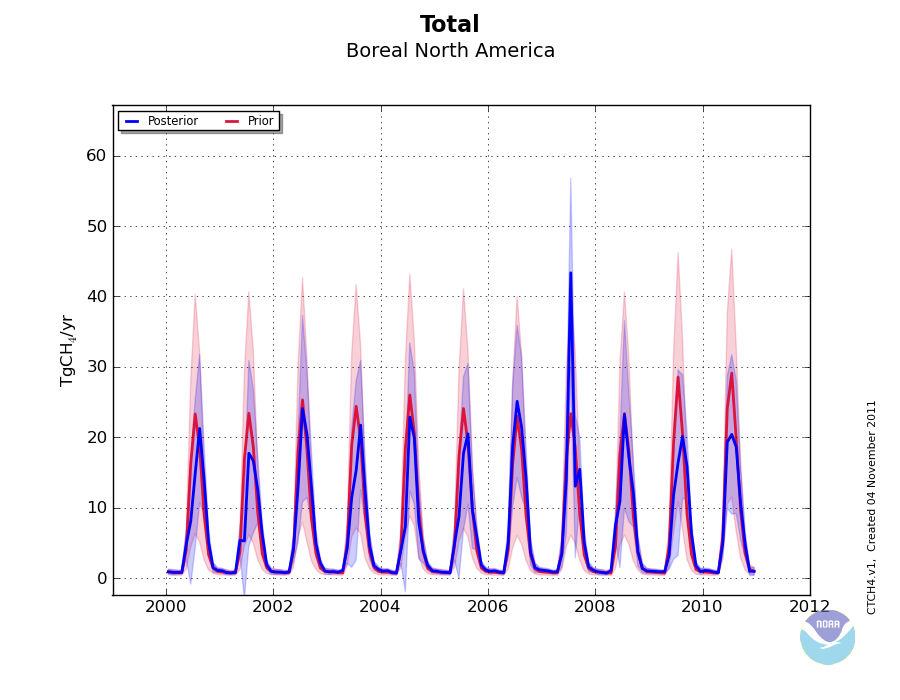
The dominant CH4 emission from Northern Polar regions is from wetlands, with small contributions from leaks associated with fossil fuel production. Total Polar emissions are ~80 TgCH4/yr out of about ~520 TgCH4/yr globally. Methane flux estimates show considerable inter-annual variability, and this is likely linked to year-to-year changes in temperature and precipitation, as well as (to a lesser extent) fires. Microbial production of CH4 is greatest in warm and wet conditions. The figures below show that emissions from Boreal Eurasia were exceptionally large during 2007 and 2010, while emissions from Boreal North America were exceptionally high during 2007. 2007 was a year of exceptional warmth in the Arctic and unprecedented growth of observed methane at High Northern latitudes (Dlugokencky et al., 2009). CarbonTracker-CH4 is able to discriminate between methane emissions from Boreal Eurasia and Boreal North America due to the presence of observation sites between the two source regions, and due to the fact that oceanic emissions are usually much smaller than terrestrial emissions.
Tropical Fluxes
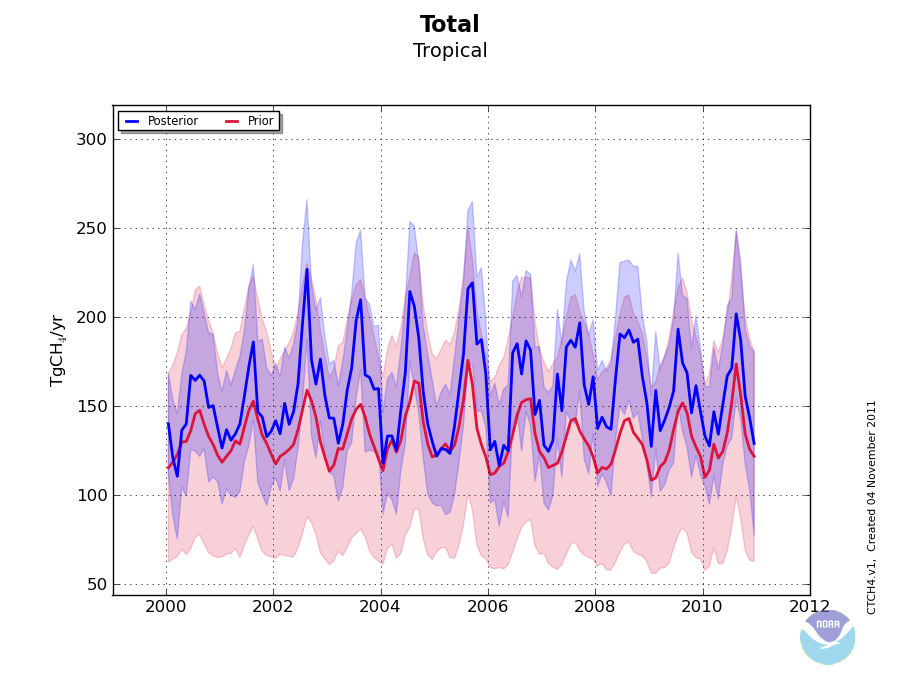
Although emissions of CH4 from tropical wetlands are a important contribution to the global budget, CarbonTracker flux estimates are not very reliable in this region because of a lack of observation sites in continental tropical regions. The result is that estimated tropical fluxes tend to have small uncertainty reductions and inter-annual variability is not well captured. Time series of estimated tropical fluxes also exhibit what is likely to be unrealistic short period variability (noise). Because of the lack of observational constraints, the estimated fluxes are not greatly changed from the prior flux estimates, and these are also highly uncertain. Tropical regions are difficult to monitor, however it is possible that use of space-based or aircraft measurements could help to constrain tropical emissions in the future.
Uncertainty
The goal of an atmospheric assimilation like CarbonTracker is to obtain estimates of emissions and distributions of atmospheric species by combing the best prior knowledge of emissions and sinks with observations. As such, the uncertainty estimates produced are themselves based on best-guess projections of uncertainty on prior emission estimates and an educated guess of how well the transport model is able to simulate concentrations at observation sites. The estimated fluxes and assimilated concentration fields are very sensitive to choices in uncertainty parameters, yet these quantities are not well known. Evaluation techniques that can give confidence in the results are described in more detail below.
It is also important to keep in mind that in regions where observational constraints are not available, the flux estimates are little changed from prior flux estimates. Any bias in the prior flux estimates will result in biased posterior flux estimates. It is therefore important to use best available prior flux estimates. Because many processes that emit methane are very localized and likely not in proximity to observation sites, the spatial distribution of the prior fluxes are an important constraint on the inversion. CarbonTracker will not provide an estimate for fossil fuel emission in a particular region, for example, unless the prior flux distribution includes fossil fuel emissions in that region. Finally, this first version of CarbonTracker-CH4 provides emissions for relatively coarse spatial resolution regions: 12 continental scale and 1 global ocean region. In future versions of CarbonTracker-CH4, we will increase the spatial resolution of source regions.
Evaluation
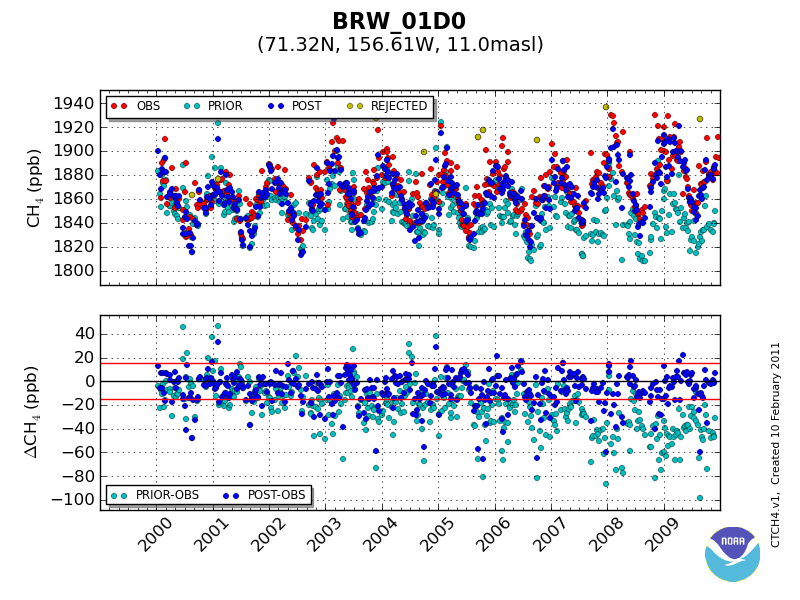
The figure below shows a comparison of the simulated prior and posterior mole fractions along with the observed mole fractions at Barrow, Alaska. Note that this site was used in the assimilation, so the posterior mole fractions are expected to be in better agreement with the observations than the simulated prior mole fractions. The bottom panel of the figure shows that the differences between posterior and observed mole fractions are within the limits of the assumed model-data mismatch error indicating consistency between the statistical assumptions used in the assimilation. (See more figures like this)
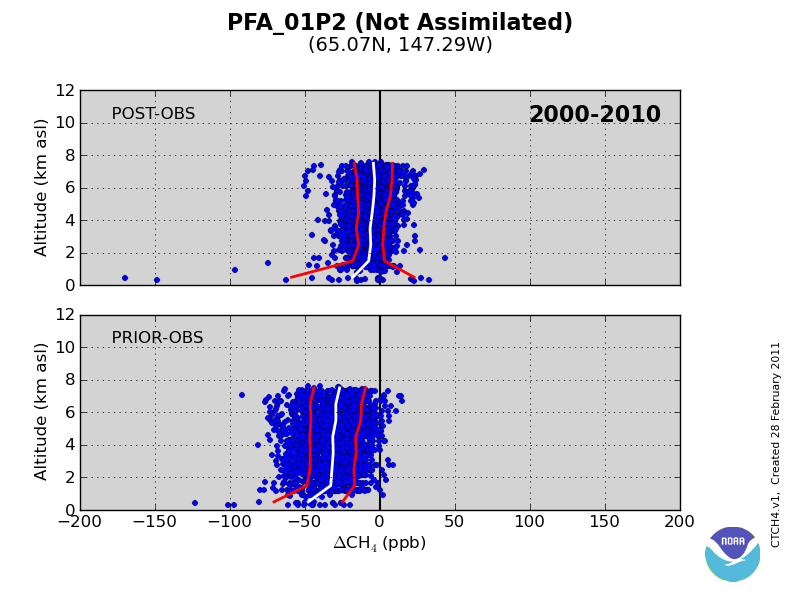
Comparison of posterior methane profiles with observations at aircraft sampling sites is a good test of the inversion since aircraft observations are not currently used in the assimilation. For the figure shown below, profiles of methane mole fraction without assimilation show a considerable bias at all altitudes. After assimilation of surface observations, bias is significantly reduced. The standard deviation of the residuals (red lines) are also closer to the mean of the differences between the posterior and observations (white line), another indication that the assimilation is resulting in methane profiles that are in better agreement with observations. This gives us confidence that the global posterior distribution of methane is more realistic than the prior global distribution.(See more figures like this)
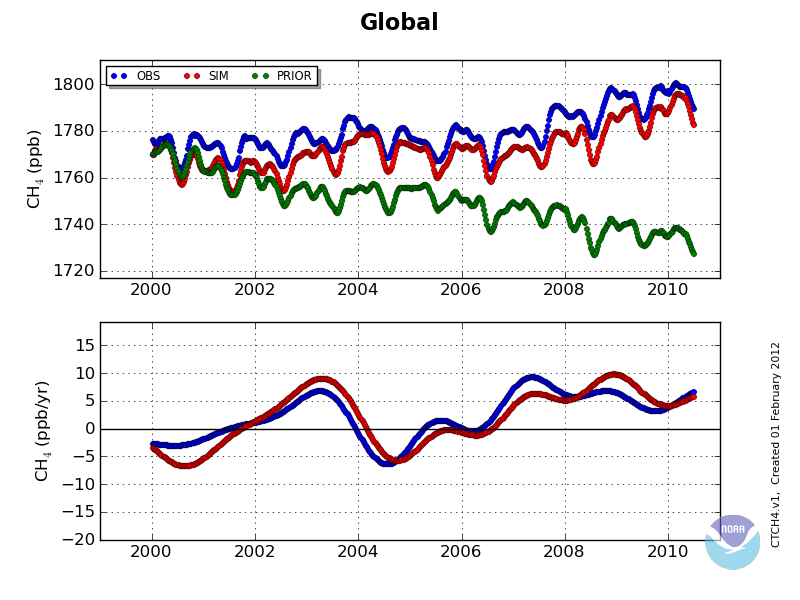
A final evaluation tool is to look at simulated and observed large-scale average quantities. An example is global-average methane abundance and growth rates, shown below. The top panel shows that global average CH4 abundance diverges from the observations over time if only prior flux estimates are used. On the other hand, the posterior global methane abundance represents an optimal compromise between information coming from the prior flux estimates and observational constraints. In principle, the agreement between posterior and observed global average methane could be improved by weighting the observations more in the assimilation, however, this would result in noisier flux timeseries.
The CH4 growth rate is shown in the bottom panel. This quantity is obtained by computing the first derivative of the de-seasonalized global methane time-series and is directly related to emissions and sinks of atmospheric methane. The growth rate is fairly well reproduced by CarbonTracker-CH4, although small differences suggest under or over-estimation of global emissions and sinks.(See more figures like this)

