
NOAA Carbon Dioxide (CO2) measurements first began in 1967 at the Niwot Ridge high altitude research station, Colorado (3523 masl). Since then, the CCGG cooperative air sampling network measures CO2 from more than 50 sites world wide. In-Situ continuous measurements of CO2 at the NOAA GML Atmospheric Baseline Observatories began in 1973. Additional in-situ measurements from tall towers and light aircraft in the USA began in the 1990's, to support studies on continental sources and sinks of greenhouse gases. Vertical profile data from the AirCore Sampling System began in 2012 to monitor greenhouse gases at high altitudes and to help evaluate remote sensing measurements.
Note: Links are to zip archive files. Observatory data includes hourly, daily and monthly averages. Tower data includes hourly averages. Flask data is for discrete samples.
View map and listing of the reference network sites...
Individual data sets can be searched for and downloaded from the GML Data Finder, or browse through archived data files.
Figures and Data from the Marine Boundary Layer (MBL) Reference are also available. The MBL is a data product derived directly from measurements of weekly air samples from the Cooperative Air Sampling Network.
Marine Boundary Layer Reference Data
Data from the Reference Network as well as data from over 400 agencies worldwide are available as ObsPack products. ObsPack products are designed to bring together direct atmospheric greenhouse gas measurements derived from multiple national or university laboratories, and package and distribute them in a set of self-documenting files. ObsPack products include a set of prepared data sets and metadata, a summary of included data sets, and an e-mail address list of all data providers.
Download ObsPack data products here.
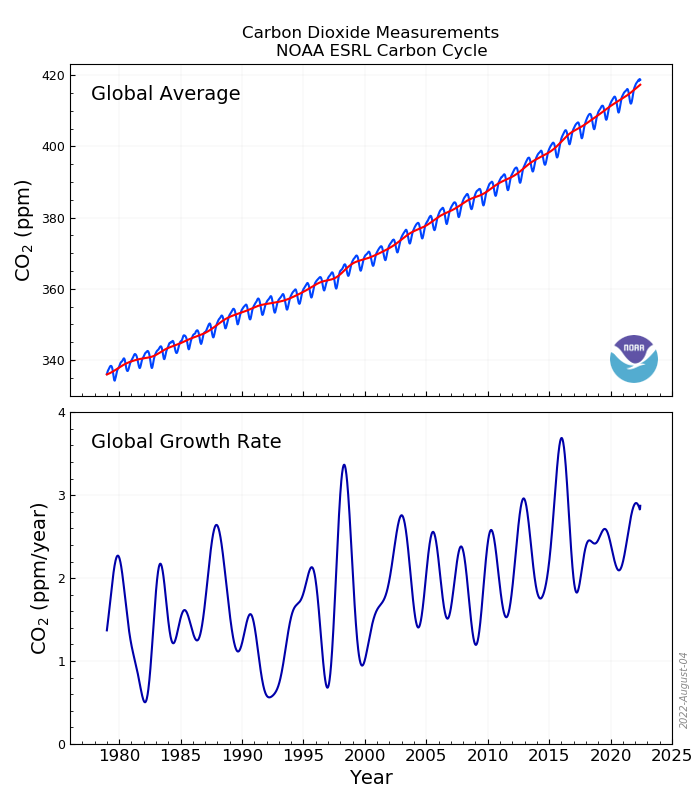
Top: Global average atmospheric carbon dioxide mixing ratios (blue line) determined using measurements from the Carbon Cycle cooperative air sampling network. The red line represents the long-term trend. Bottom: Global average growth rate for carbon dioxide.
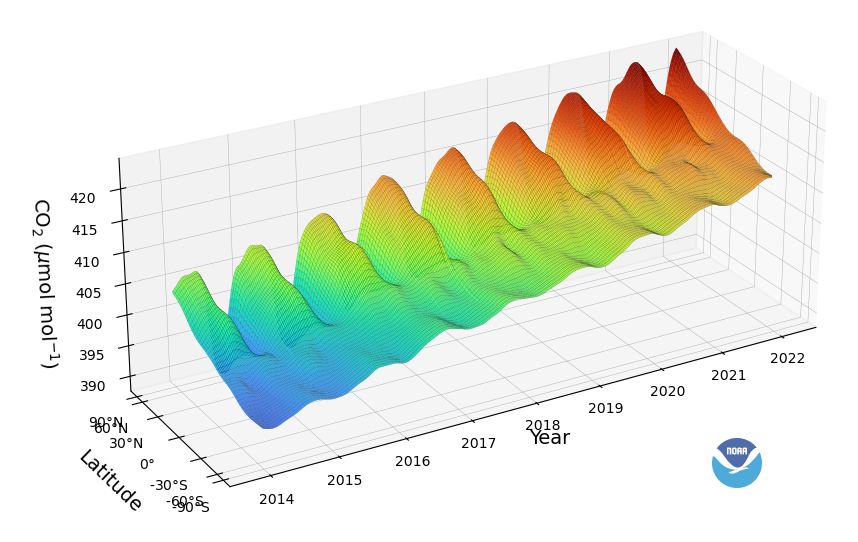
Three-dimensional representation of the latitudinal distribution of atmospheric carbon dioxide in the marine boundary layer. Data from the Carbon Cycle cooperative air sampling network were used. The surface represents data smoothed in time and latitude.
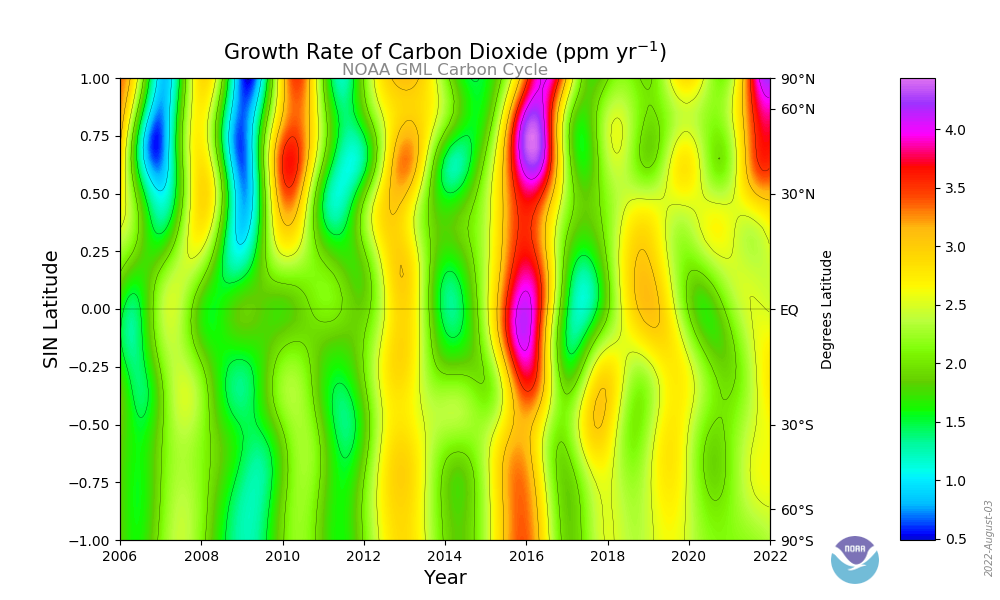
Contour plot showing the temporal and spatial variations in the atmospheric increases of carbon dioxide. The cooler colors (green, blue) represent periods of lower than average growth rates and the warmer colors (yellow, orange, red) represent periods of higher growth rates. The plot is derived from measurements of samples collected at the Carbon Cycle cooperative air sampling network sites. The variations in the growth rate of this climatically important gas are due to interannual variations in the imbalance between sources and sinks, and also to variations in atmospheric transport.