
Aerosol Optical Properties Calculated from Size Distributions, Filter Samples and Absorption Photometer Data at Dome C, Antarctica
A. Virkkula1, H. Grythe2, J. Backman1, T. Petäjä3, M. Busetto4, C. Lanconelli4,5, A. Lupi6, S. Becagli7, R. Traversi7, M. Severi7, V. Vitale6, P. Sheridan8 and E. Andrews9,8
1Finnish Meteorological Institute, Helsiniki, Finland; +358-505-720-250, E-mail: aki.virkkula@fmi.fi
2Norwegian Institute for Air Research (NILU), Kjeller, Norway
3University of Helsinki, Institute for Atmospheric and Earth System Research (INAR)/Physics, Helsinki, Finland
4Institute of Atmospheric Sciences and Climate, National Research Council of Italy, Bologna, Italy
5European Commission, Joint Research Centre, Ispra (VA), Italy
6National Research Council of Italy, Institute of Polar Sciences (CNR-ISP), Bologna, Italy
7University of Florence, Dept. of Chemistry, Sesto Fiorentino, Florence, Italy
8NOAA Global Monitoring Laboratory (GML), Boulder, CO 80305
9Cooperative Institute for Research in Environmental Sciences (CIRES), University of Colorado, Boulder, CO 80309
Optical properties of surface aerosols at Dome C, Antarctica in 2007-2013 are presented. Scattering coefficients (σsp) were calculated from particle number size distributions and filter samples. Absorption coefficients (σap) were determined with a 3-λ Particle Soot Absorption Photometer (PSAP) and corrected for scattering by using two different algorithms. The scattering coefficients were also compared with σsp measured at the South Pole Station (SPO). The minimum σap was observed in the austral autumn and the maximum in the austral spring. The lowest single scattering albedo wo ≈ 0.91 was observed in September and October and the highest wo ≈ 0.99 in February and March. The equivalent black carbon (eBC) mass concentrations were compared with eBC at the SPO, Neumayer and Syowa. The maximum monthly median eBC concentrations are ~3 ± 1 ng m-3 at all these sites in October-November.
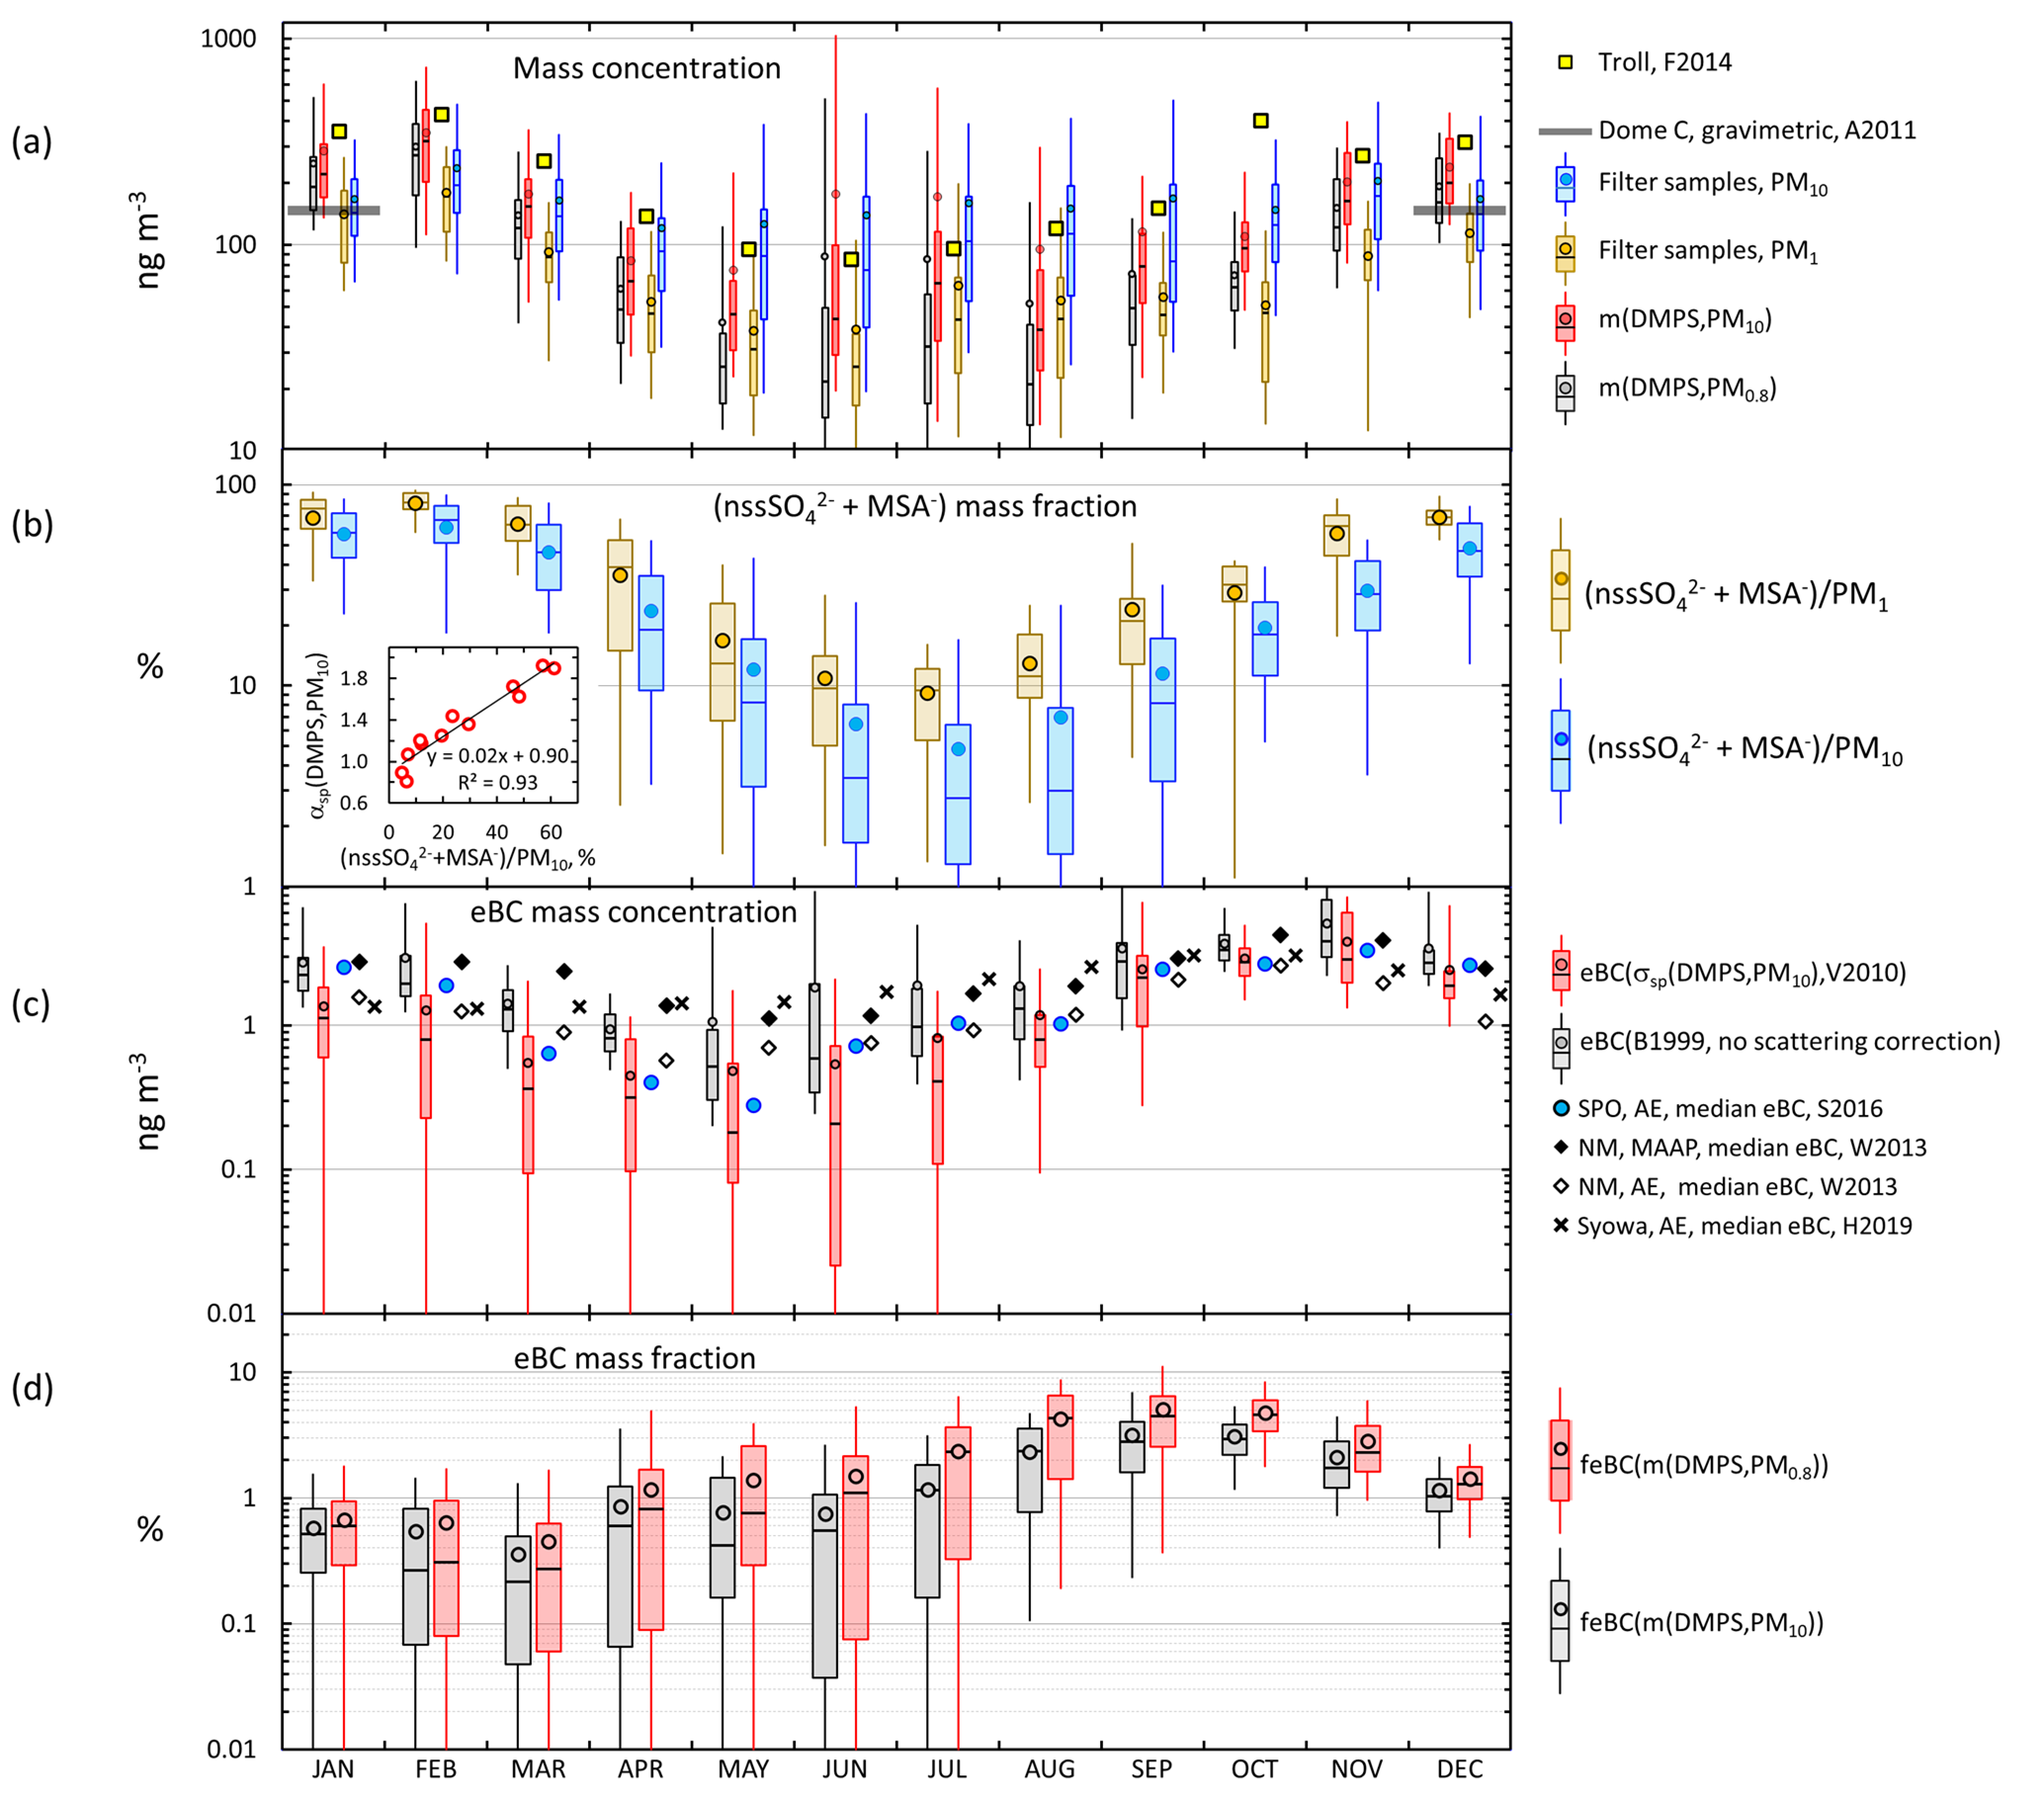
Figure 1. Seasonal cycles of a) aerosol mass concentrations, b) mass fraction of the sum of nssSO42- and methane sulfonc acid (MSA) in PM1 and PM10 filters, c) equivalent black carbon (eBC) concentrations, and d) eBC mass fractions.