
The Kennaook/Cape Grim Particle Number Concentration (CN3) Record:1978-2020
M. Keywood
Commonwealth Scientific and Industrial Research Organisation (CSIRO), Oceans and Atmosphere, Aspendale, Victoria, Australia; 0402551207, E-mail: melita.keywood@csiro.au
Marine aerosol is globally one of the most important natural aerosol systems, contributing to the Earth’s radiative budget, biogeochemical cycling, impacts on ecosystems and regional air quality. The Southern Ocean is one of the cleanest regions of the globe and is often referred to as a proxy for the pre-industrial atmosphere. It is also a region where Earth System models show a strong bias in radiative forcing, and this has been attributed to the inability of these models to accurately simulate clouds and aerosols over the Southern Ocean (e.g., Bodas-Salcedo et al., 2014). While the past five years have seen an increase in the number of observation campaigns that will contribute data needed to resolve these biases (e.g. Humphries et al., 2021), observations of aerosol properties at the Kennaook/Cape Grim Baseline Air Pollution Monitoring Station have been ongoing since the late 1970s resulting in invaluable long term data sets of aerosol properties that provide temporal context for the recent shorter term campaign data and provide information to assess changes to Southern Ocean aerosol properties over time.
The Kennaook/Cape Grim Baseline Air Pollution Monitoring Station is located in the northwest of Tasmania Australia and for approximately 30% of the year samples air masses that have only passed over the Southern Ocean. Aerosol measurements at Kennaook/Cape Grim, includes the measurement of aerosol microphysical, optical and chemical properties. The number concentration or particles greater than 3 nm in diameter (CN3) constitutes the longest record aerosol record at Kennaook/Cape Grim. The CN3 record commenced in 1976 using a manually operated Pollack Condensation Particle Counter, which was automated in 1978 and operated until 2008. In 1999 the TSI 3025 condensation particle was introduced to the program and this and subsequent TSI models continue to contribute to the record. When investigating trends in long term data sets, it is important to ensure that the trends observed are not the result of changes to the measurement program. To this end, a significant period of overlap between new and aging instruments is required to ensure agreement between instruments before the older instrument is replaced by the new instrument. While excellent correlation between TSI CPC instruments that have operated post 2010 exists, corrections are required for data sets collected with the different particle counters before 2010.
A preliminary assessment of the long-term trend in the record Kennaook/Cape Grim CN3 record between 1978 and 2020 indicates a slight, but significant increase in baseline CN3 concentrations is observed (0.8% per year), similar to the trend determined by Gras (1995) for data collected at Kennaook/Cape Grim between 1977 and 1992. The greatest rates of change occur during the Southern Hemisphere spring and summer seasons, with no increase observed over the 48 years during the winter months. In this presentation these insights into changes in the background marine boundary layer particle number concentration will be discussed in the context of trends observed at other background and regional locations.
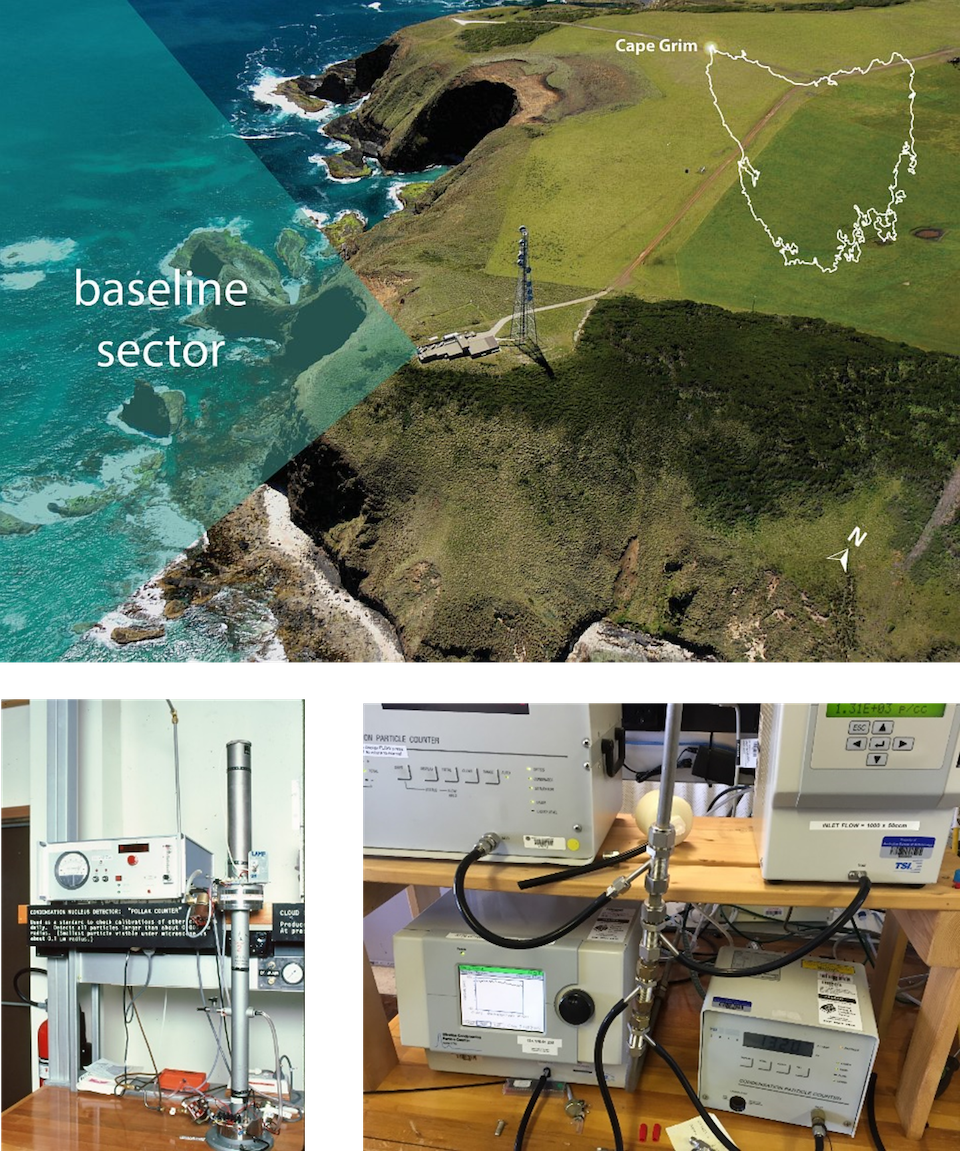
Figure 1. Figure 1 (top) Aerial photo of Cape Grim with map of Tasmanian (showing location of Cape Grim ) and baseline sector (190-280 °) superimposed (bottom) photographs of Pollack condensation particle counter (left) and TSI condensation counters (right).