
Remote Sensing Study of Ozone, NO2, and CO over India: some Contrary Effects of SARS-CoV-2 Lockdown in the Free Troposphere
P. Rawat and M. Naja
Aryabhatta Research Institute for observational sciencES (ARIES), Department of Science and Technology (DST), Atmospheric Science Division, Govt. of India, Nainital, Uttarakhand, India; +91-7500113782, E-mail: prajjwal@aries.res.in
To impede the spread of coronavirus diseases, a nationwide lockdown was imposed over different countries worldwide, including India. Here, we utilize IASI, OMI, TROPOMI, and GOME-2 data to quantify the effect of lockdown on the changes in ozone, carbon monoxide (CO), and nitrogen dioxide (NO2) over India with a primary focus on the tropospheric profiles of ozone and CO as compared to the years 2018 and 2019. To minimize the biases in the conclusions, changes in ozone, CO, and NO2 are studied for 2018, apart from 2019. Twelve populated cities and India's largest thermal power plants were selected to quantify lockdown effects. Ozone does not change uniformly over India in horizontal and vertical space. An increase (>20%) of vertical ozone distribution (up to 8 km) during lockdown was observed over central and western India compared to both 2019 and 2018 and decreased over the southern coastal regions. However, in the northern and northeast regions, a significant reduction (> 20%) compared to 2018 and a dramatic increase (> 20%) compared to 2019 is observed distinctly in northern regions. The increased ozone over northern India, particularly in contrast to 2019, further shows a successive increase with higher altitudes and exhibits the role of dynamics, while, for other places like western and central India, the excessive ozone decreases with height shows the effect of photochemistry and surface emissions. The columnar abundance of CO shows a reduction (5 – 10%) over northern India, including the IGP region, and an increase over central and western India (10 - 20%). The mixing ratio profile of CO shows mostly a reduction in the boundary layer, whereas a systematic yearly increase from 2018 to 2020 was seen in the free troposphere. Usually, reduction of tropospheric NO2 columns was seen over India, with the highest reduction over the northern regions (20 - 52%) followed by eastern (10 - 40%), southern (5 - 40%), and central (5 - 35%) regions. However, similar to CO, an increase of NO2 (~ 15%) over the western region is observed particularly compared to 2019. During the lockdown, the tropospheric ozone column increased over the northern region by about 15DU compared to 2019; however, a significant decrease (~ 10DU) compared to 2018 is observed. With a primary focus on the tropospheric ozone here, this study highlights the complex control mechanism of secondary pollutants like ozone, whose concentrations are altered via emission, but dynamics and ambient meteorology also play a significant role.
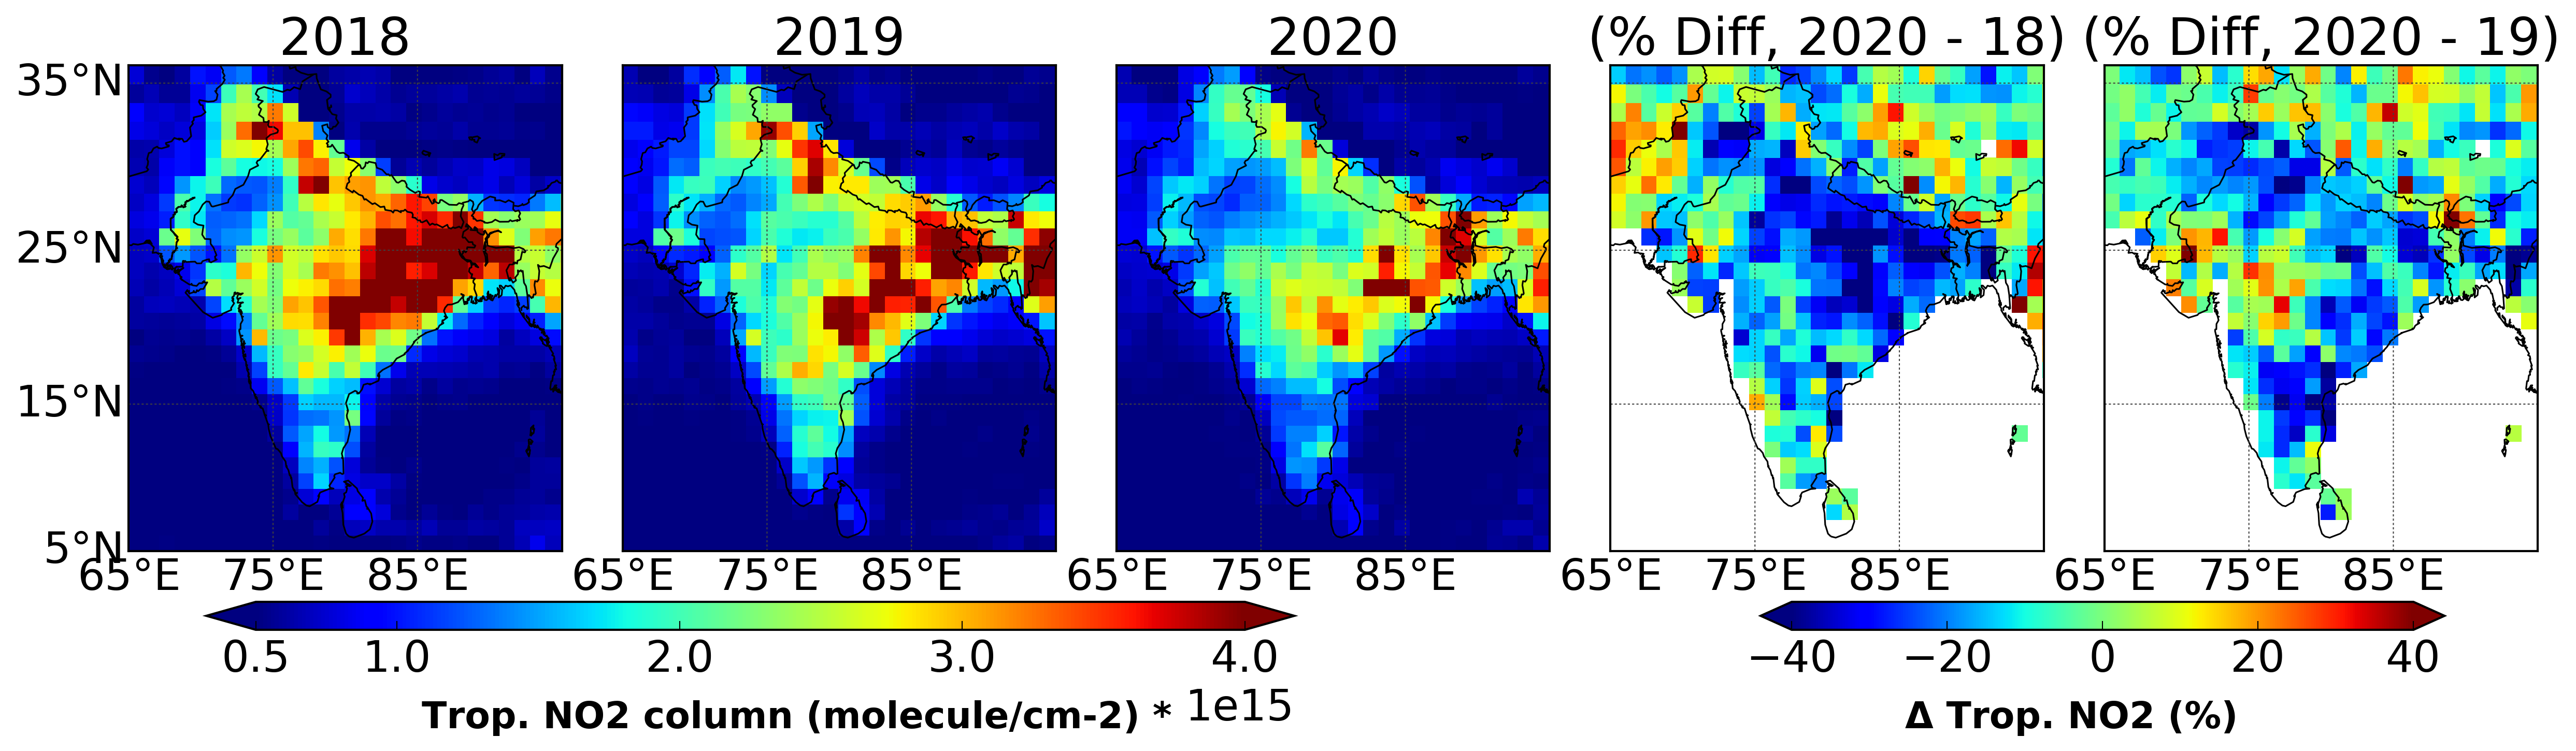
Figure 1. Tropospheric OMI NO2 spatial distribution (re-gridded to coarser 1° × 1° resolution) was observed over India from 24 March to 20 April in 2018, 2019, and 2020. Percentage changes in NO2 during 2020, for 2018 and 2019, are also shown.