
Tropical Tropospheric Ozone Distribution and Trends
A. Gaudel1,2, M. Li1,2, I. Bourgeois1,2, O.R. Cooper1,2, K. Chang1,2, B. Sauvage3, J. Ziemke4, A. Thompson5, R. Stauffer5 and N. Smith6
1Cooperative Institute for Research in Environmental Sciences (CIRES), University of Colorado, Boulder, CO 80309; 303-497-6563, E-mail: audrey.gaudel@noaa.gov
2NOAA Chemical Sciences Laboratory (CSL), Boulder, CO 80305
3Laboratoire d’Aérologie, Université de Toulouse, CNRS, UPS, France
4University of Maryland, College Park, MD 20742
5NASA Goddard Space Flight Center (GSFC), Atmospheric Chemistry and Dynamics Laboratory, Greenbelt, MD 20771
6Science and Technology Corporation, Boulder, CO 80305
Tropospheric ozone is the third most important greenhouse gas, is detrimental to human health and crop and ecosystem productivity, and controls the oxidizing capacity of the troposphere. Tropospheric ozone in the tropics has been shown to be quickly increasing especially in Southeast Asia compared to regions in the Northern mid-latitudes, and based on model simulations the global ozone increases have been mostly explained by the shift of emissions toward the equator. Current and future geostationary satellite missions are designed to monitor air composition for air quality and climate purposes. Unfortunately, the tropics are not always covered. In this context, the present study presents the analysis of in situ data to assess the tropical tropospheric ozone distribution and trends, and evaluates current polar orbiting satellite products.
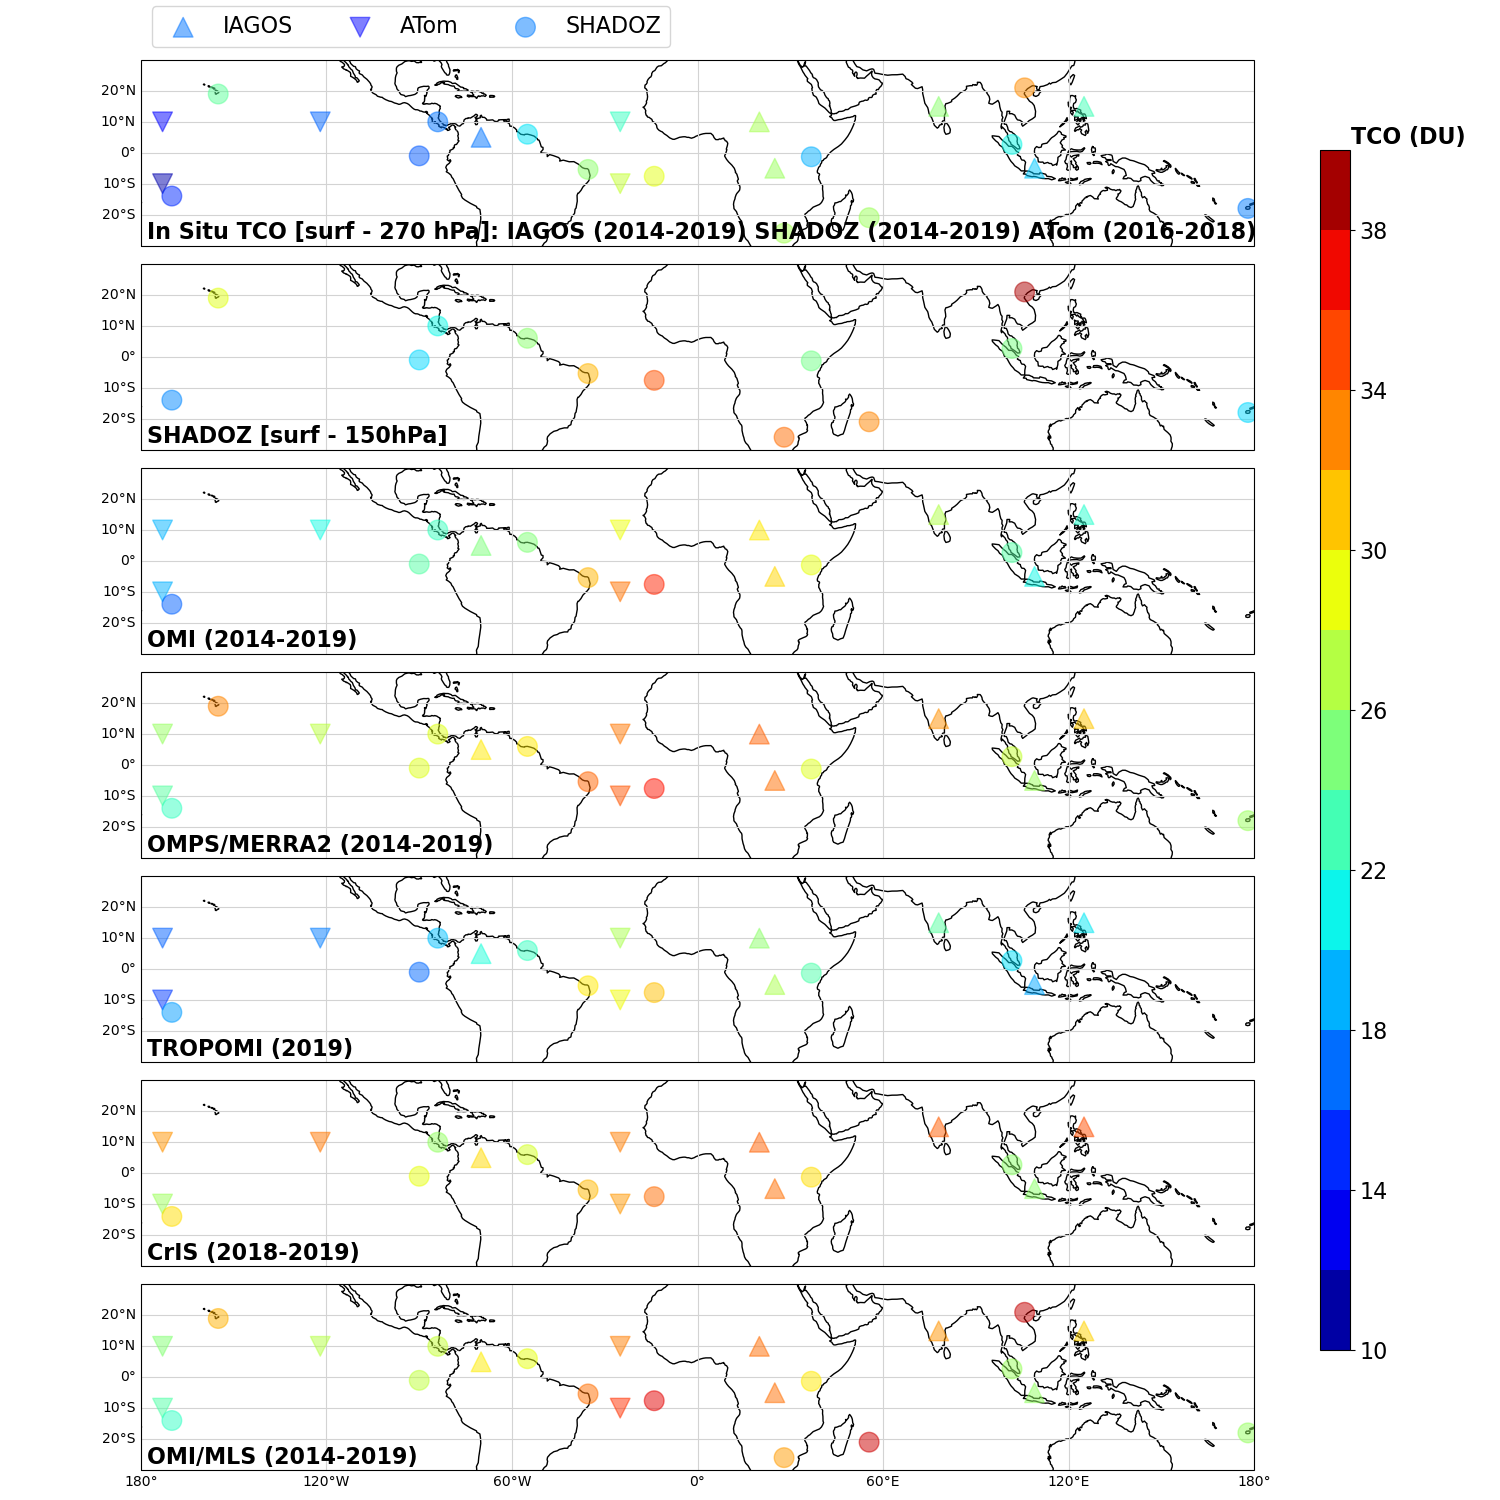
Figure 1. Tropospheric Column Ozone (TCO, surface-270 hPa) from in situ data (IAGOS, SHADOZ and ATom) (top panel), TCO (surface-150 hPa) from SHADOZ (2nd panel), and from OMI, OMPS/MERRA2, TROPOMI, CrIS and OMI/MLS.