
Measuring and Interpreting Particulate Mass Concentration using the Tapered Element Oscillating Microbalance (TEOM) at Appalachian State University
E. Barber, R. Brown and J. Sherman
Appalachian State University, Department of Physics and Astronomy, Boone, NC 28608; 919-309-6518, E-mail: barberea@appstate.edu
Measuring particulate matter mass concentrations in the atmosphere plays a role in understanding and quantifying environmental health risks, as well as, climate changing patterns associated with air quality. Specifically, atmospheric particles with diameters of less than 2.5 microns (PM2.5) have been shown to cause extensive health problems such as cardiopulmonary disease and death. Starting in November of 2016, Appalachian State University has been continuously recording particulate mass concentrations from the top of the library parking deck, using a Tapered Element Oscillating Microbalance (TEOM). This instrument, being provided by the NC Division of Air Quality, uses a hollow glass tube as a microbalance and a filter that collects deposited aerosol particles. In turn, the deposited particles on the filter change the oscillating frequency of the balance and provide measurements on the rate at which aerosol mass changes. The rate at which the particulate mass changes in conjunction with the volumetric flow rate of the samples taken, are used to calculate aerosol mass concentrations. The TEOM is favored over other high-volume air samplers due to its relatively infrequent need for filter change and its ability to continuously record mass concentrations, which are averaged over 10-minute, 30-minute, 1-hour, and 24-hour windows. Measurements taken thus far show variability in PM2.5 mass concentrations in respects to hourly, daily, and seasonal changes. Values of PM2.5 have rarely exceeded the Environmental Protection Agency's (EPA’s) fine particle standard of 35 mg/m3 at Appalachian State University, with the exception of regional transported wildfire smoke and a couple other instances of abnormal air quality events. Future air samples over longer periods of time, will help draw a broader and more accurate account of changing air quality and better help mitigate possible negative environmental health consequences.

Figure 1. Hourly PM 2.5 Mass Concentrations.
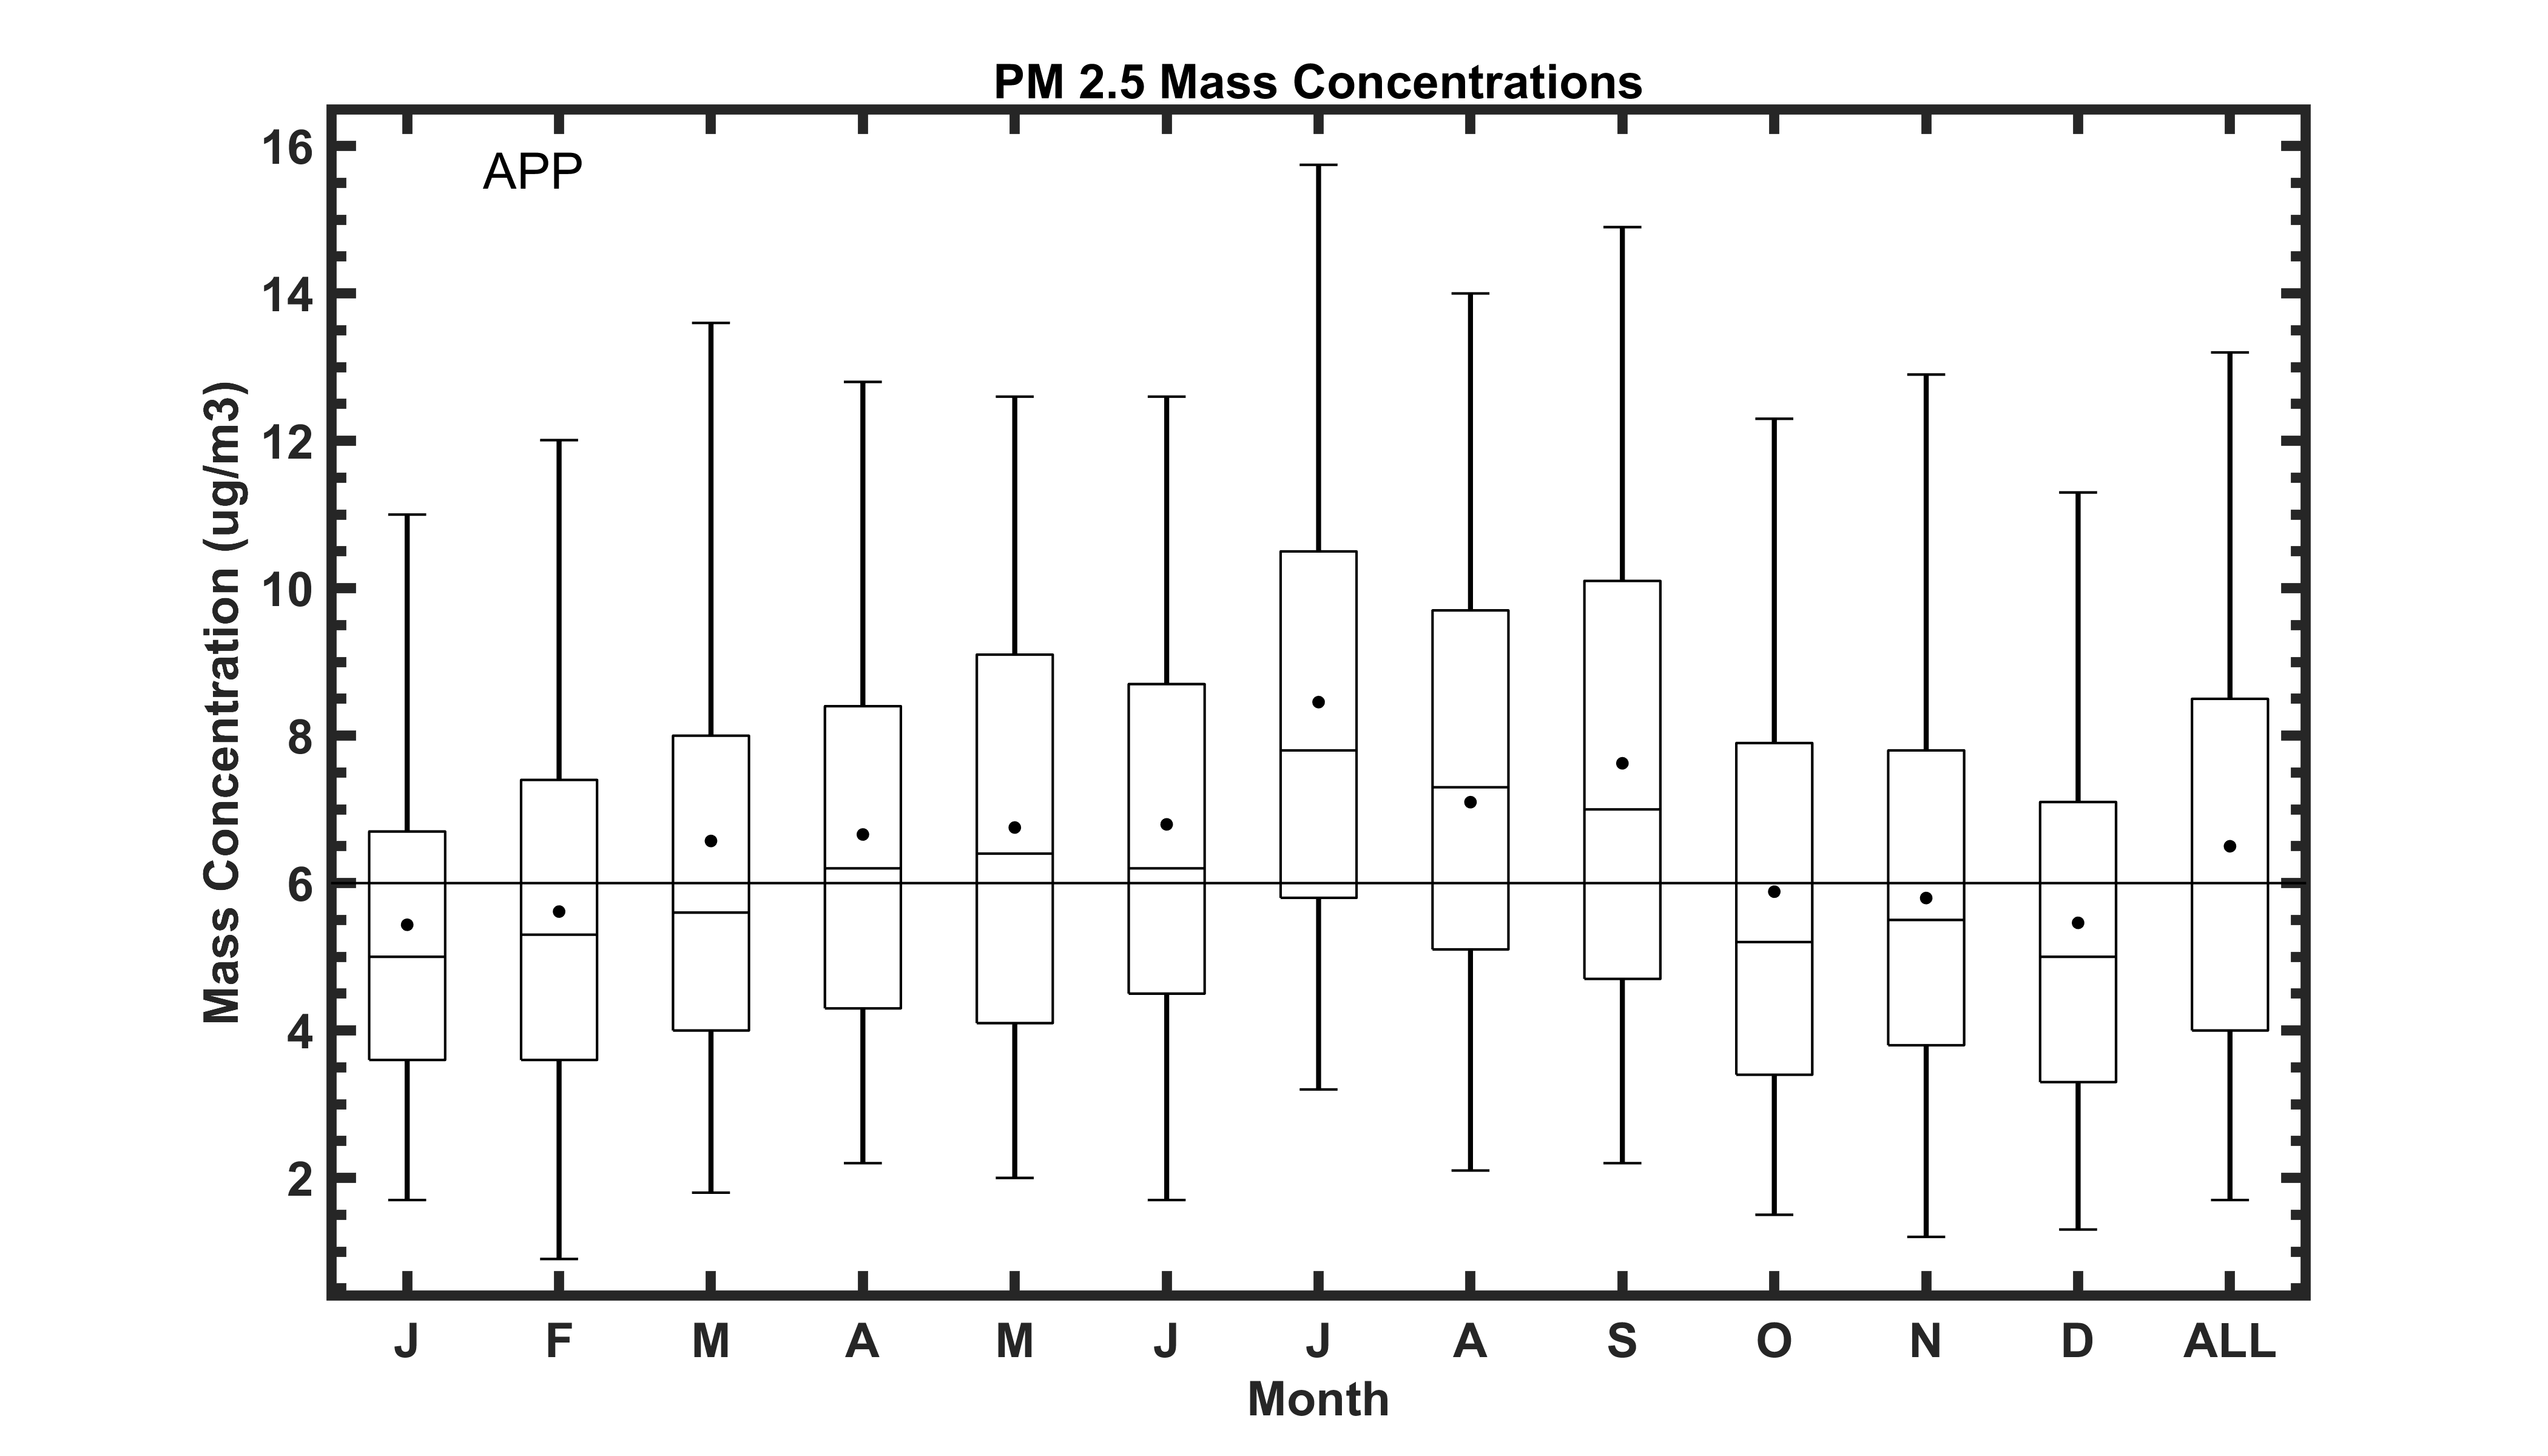
Figure 2. Monthly PM 2.5 Mass Concentrations.