
Mapping Methane Sources in the Baltimore-Washington, DC Area Using an Instrumented Mobile Platform
X. Ren1, P. Stratton2, P. Kelley1,2, W. Luke1, A. Karion3, T. Boyle3, S. Yarwood4 and R.R. Dickerson2
1NOAA Air Resources Laboratory (ARL), Silver Spring, MD 20910; 301-683-1391, E-mail: Xinrong.Ren@noaa.gov
2University of Maryland, Department of Oceanic and Atmospheric Science, College Park, MD 20742
3National Institute of Standards and Technology (NIST), Special Programs Office, Gaithersburg, MD 20899
4University of Maryland, Department of Environmental Science and Technology, College Park, MD 20742
Methane (CH4) is the second most potent anthropogenic greenhouse gas after carbon dioxide (CO2). Emissions of methane in urban areas contribute significantly to the global methane budget. Detecting and quantifying these methane emission sources in urban areas can thus help develop methane mitigation strategies and achieve climate goals. An instrumented mobile platform, called Mobile Methane and Meteorology Observation Platform (M3OP), was deployed in a field study to measure street-level methane concentration in the Baltimore-Washington, DC area. Other ancillary measurements include ethane, 13CH4 isotope, CO2, CO, NO, NO2, and black carbon as well as meteorological parameters such as ambient temperature, relative humidity, pressure, and 2-D wind with a differential GPS. Major point sources of methane such as natural gas compressor stations, landfills, and wastewater treatment plants in the area were surveyed. Street-level methane enhancements were detected. Ethane-to-methane enhancement ratios and 13CH4 isotope signatures of different methane emission sources were characterized. These mobile measurements will be further used to derive emission rates on a city scale that will be compared to aircraft mass balance and inverse estimates as well as bottom-up emission inventories. This study demonstrates that a mobile platform with a suitable suite of measurements is a useful tool to study methane emissions in urban areas.
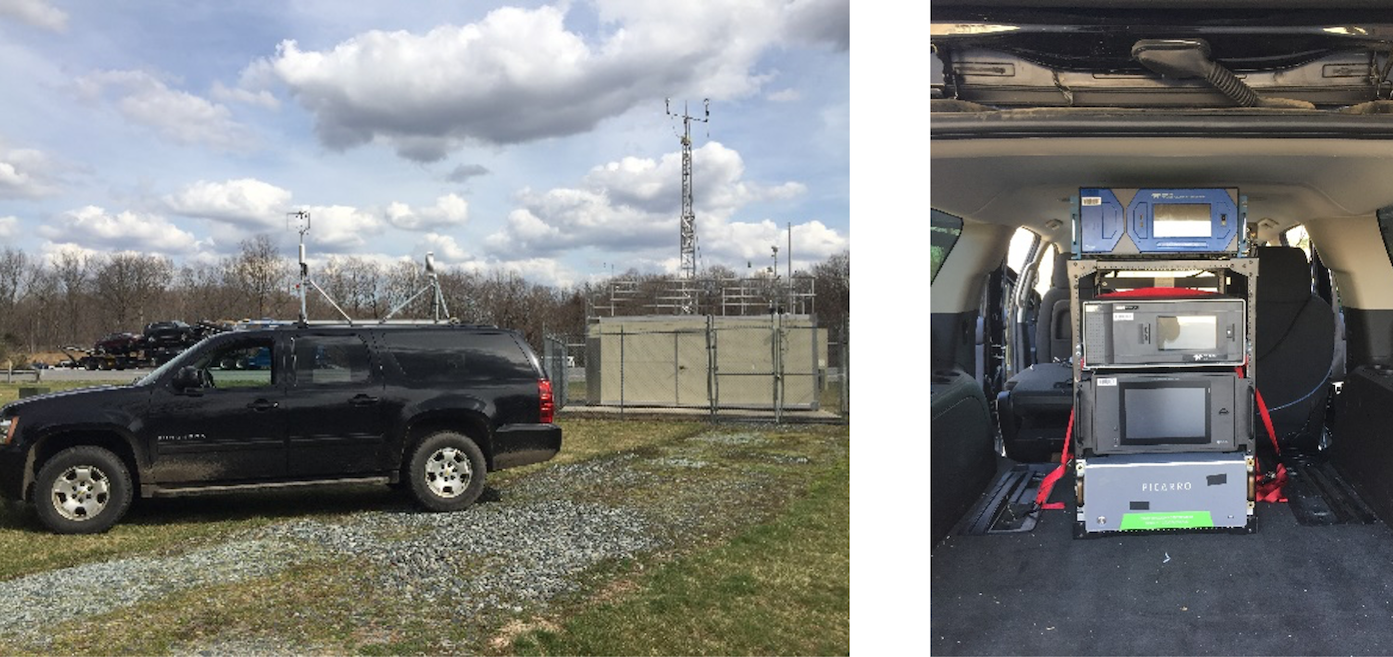
Figure 1. Left: The mobile van parked next to a near-road air quality monitoring site with instruments running. Right: Some instruments inside the mobile van.

Figure 2. Left: The driving path colored with methane mole fraction. Right: Scatter plot of ethane versus methane during the mobile measurements in downtown Baltimore, MD on April 4, 2022.